
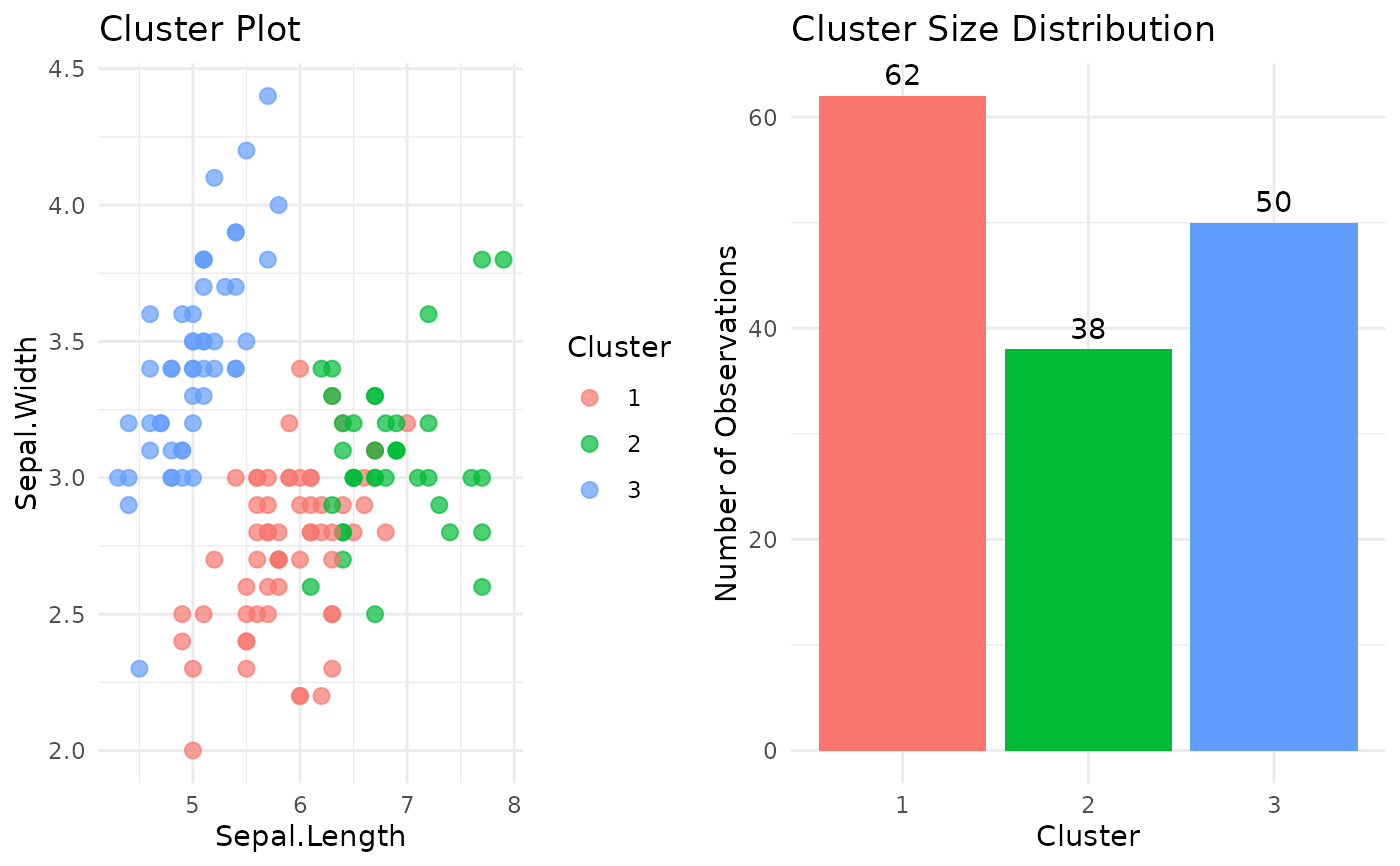
Generate a multi-panel summary of clustering results
Value
Invisibly returns a list of ggplot objects.
The combined plot grid is drawn as a side effect via
grid.arrange.
Examples
# \donttest{
df <- iris[, 1:4]
df$cluster <- kmeans(df, 3)$cluster
create_cluster_dashboard(df)
 # }
# }