Plot method for tidylearn models
Usage
# S3 method for class 'tidylearn_model'
plot(x, type = "auto", ...)
Arguments
- x
A tidylearn model object
- type
Plot type (default: "auto")
- ...
Additional arguments passed to plotting functions
Value
A ggplot object. The specific plot depends
on the model paradigm and type argument.
Examples
# \donttest{
model <- tl_model(mtcars, mpg ~ wt + hp, method = "linear")
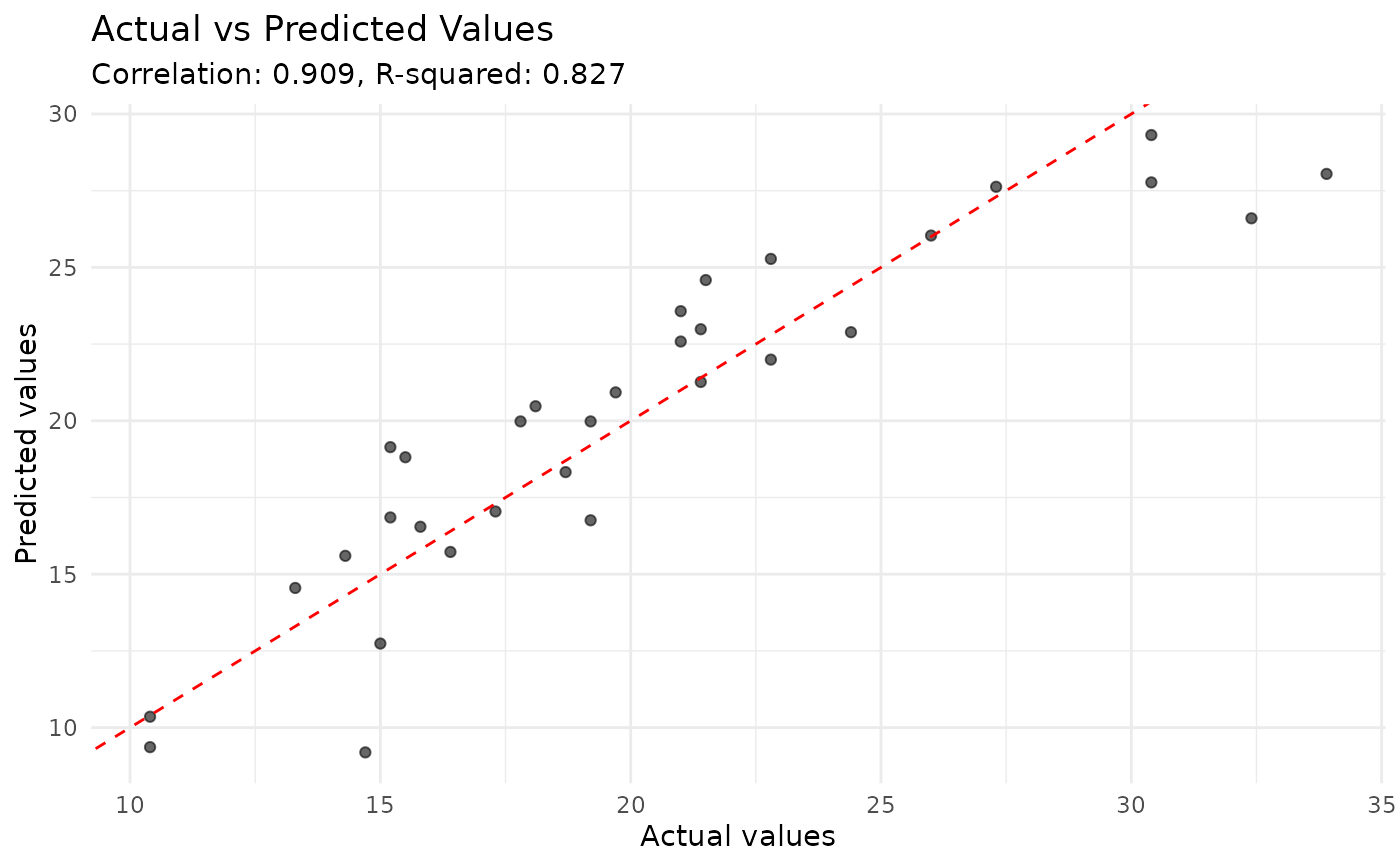
plot(model, type = "actual_predicted")
 # }
# }
