R/visualization.R
plot_cluster_comparison.Rd
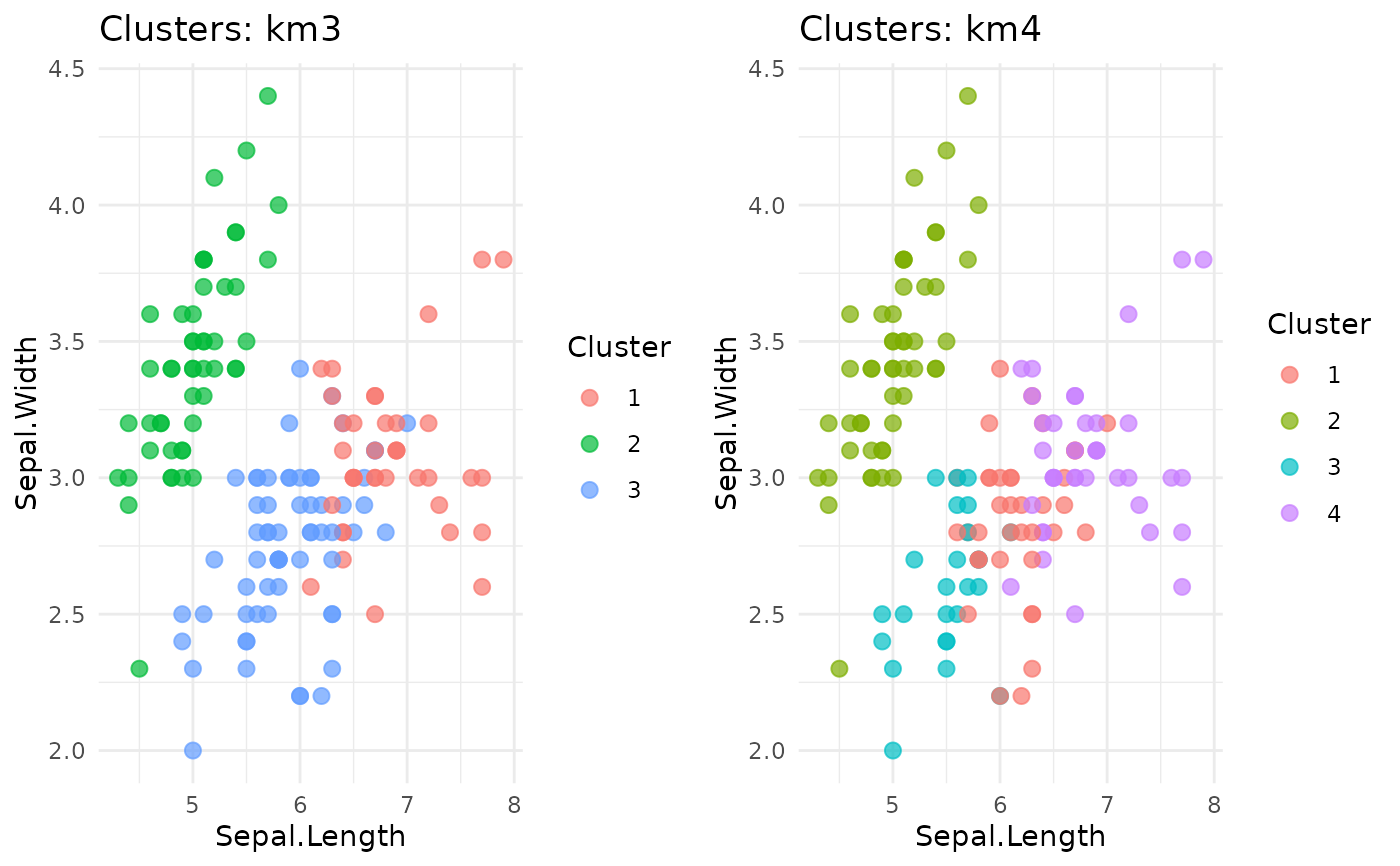
Compare multiple clustering results side-by-side
plot_cluster_comparison(data, cluster_cols, x_col, y_col)
Data frame with multiple cluster columns
Vector of cluster column names
X-axis variable
Y-axis variable
The return value of grid.arrange, a gtable drawn as a side effect.
grid.arrange
gtable
# \donttest{
df <- iris[, 1:4]
df$km3 <- kmeans(df, 3)$cluster
df$km4 <- kmeans(df, 4)$cluster
plot_cluster_comparison(df, c("km3", "km4"), "Sepal.Length", "Sepal.Width")

# }