
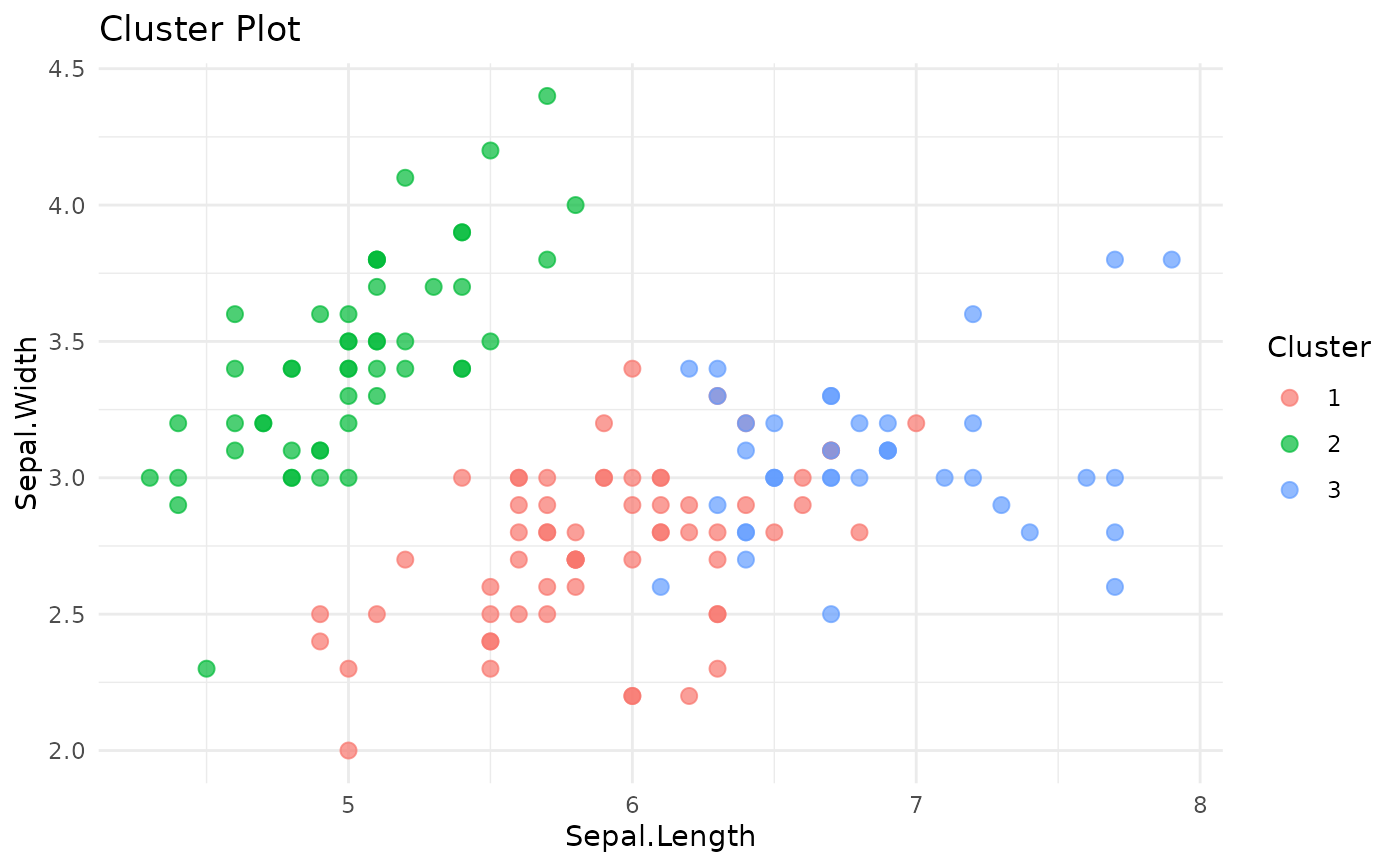
Visualize clustering results using first two dimensions or specified dimensions
Usage
plot_clusters(
  data,
  cluster_col = "cluster",
  x_col = NULL,
  y_col = NULL,
  centers = NULL,
  title = "Cluster Plot",
  color_noise_black = TRUE
)
Arguments
- data
A data frame with cluster assignments
- cluster_col
Name of cluster column (default: "cluster")
- x_col
X-axis variable (if NULL, uses first numeric column)
- y_col
Y-axis variable (if NULL, uses second numeric column)
- centers
Optional data frame of cluster centers
- title
Plot title
- color_noise_black
If TRUE, color noise points (cluster 0) black
Value
A ggplot object.
Examples
# \donttest{
km <- tidy_kmeans(iris[, 1:4], k = 3)
clustered <- augment_kmeans(km, iris[, 1:4])
plot_clusters(clustered)
 # }
# }