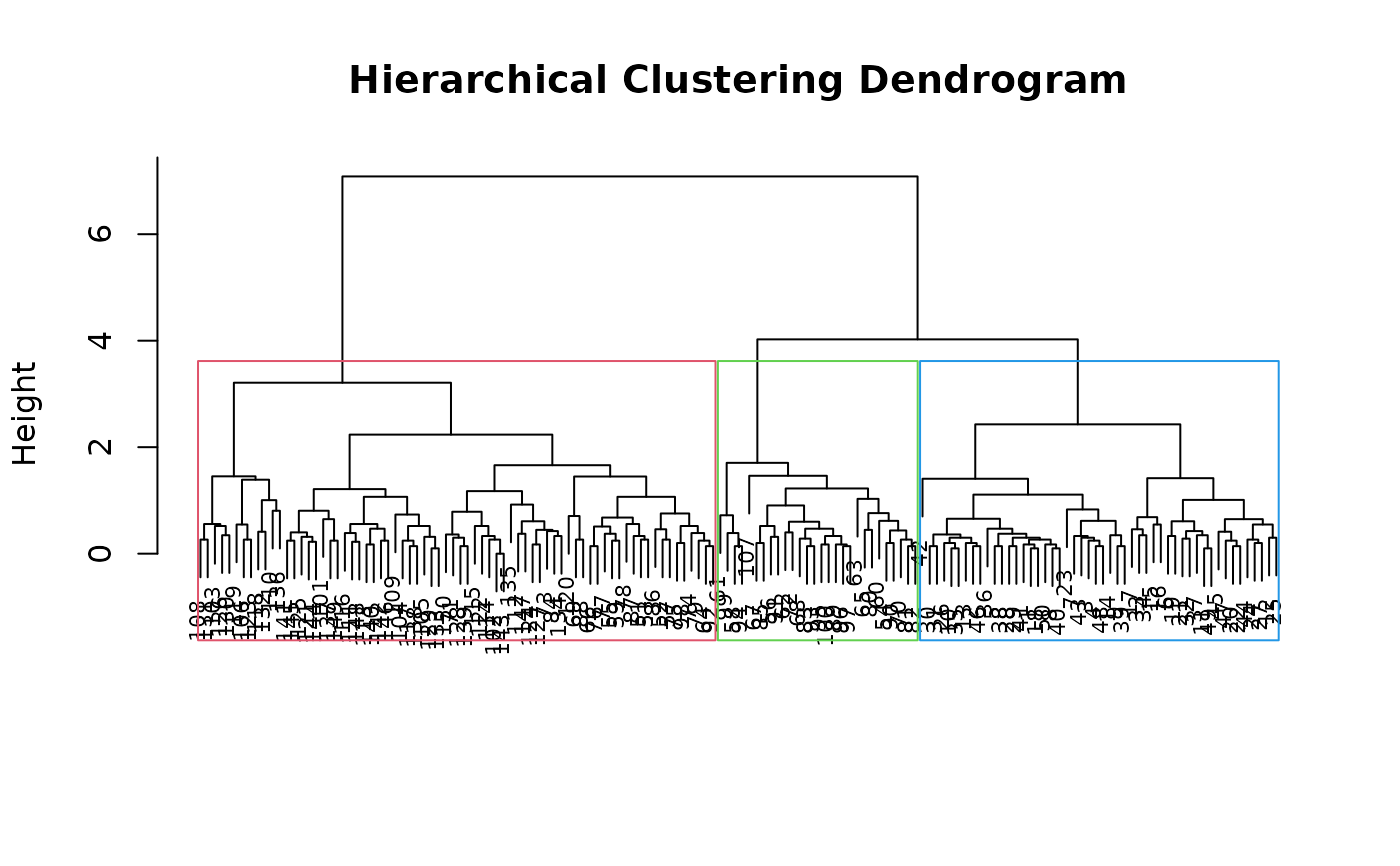
Enhanced dendrogram with colored cluster rectangles
Value
Invisibly returns the hclust object. The
dendrogram is drawn as a side effect.
Enhanced dendrogram with colored cluster rectangles
Invisibly returns the hclust object. The
dendrogram is drawn as a side effect.