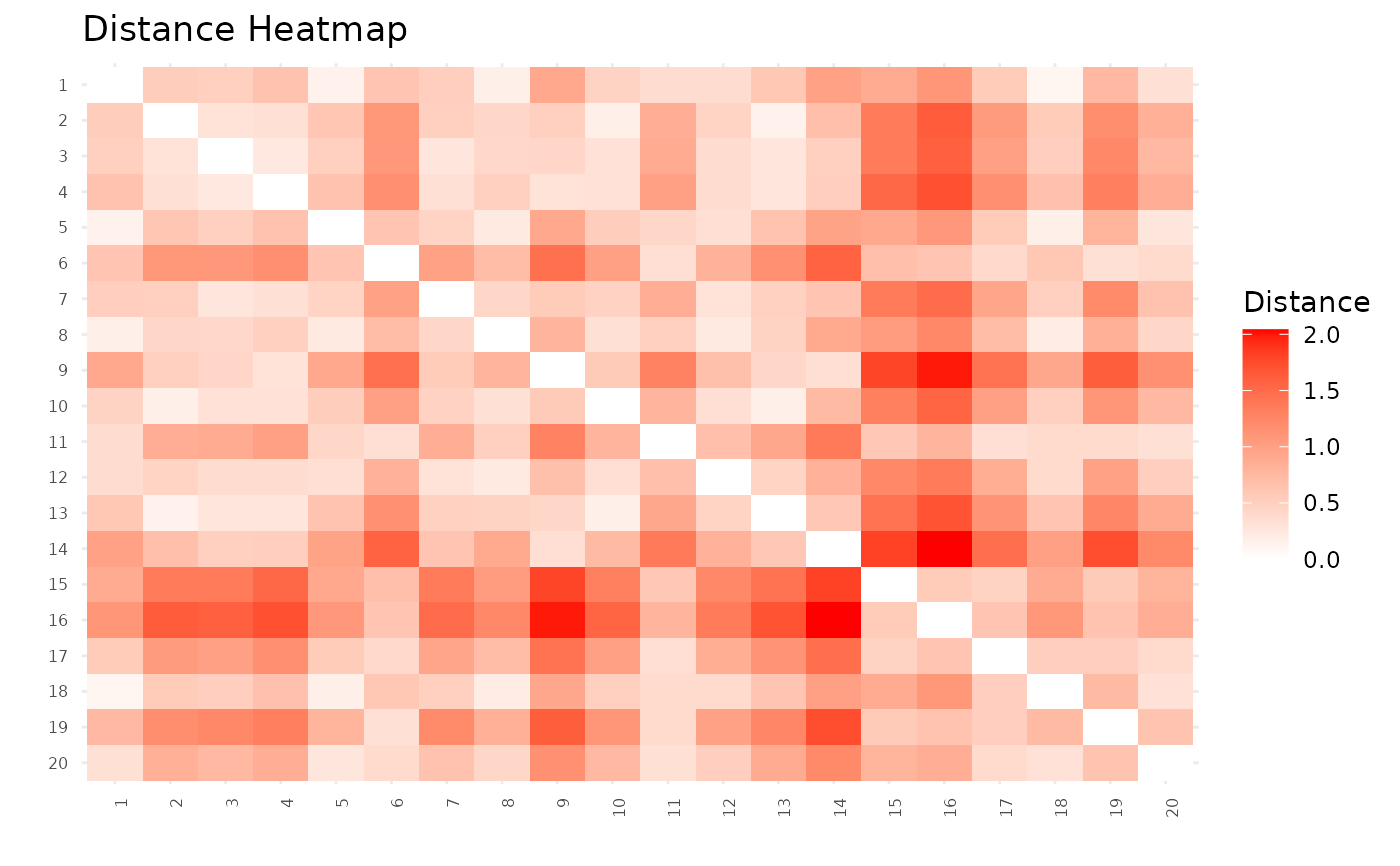
Visualize distance matrix as heatmap
Usage
plot_distance_heatmap(
  dist_mat,
  cluster_order = NULL,
  title = "Distance Heatmap"
)
Arguments
- dist_mat
Distance matrix (dist object)
- cluster_order
Optional vector to reorder observations by cluster
- title
Plot title
Examples
# \donttest{
d <- dist(iris[1:20, 1:4])
plot_distance_heatmap(d)
 # }
# }
