
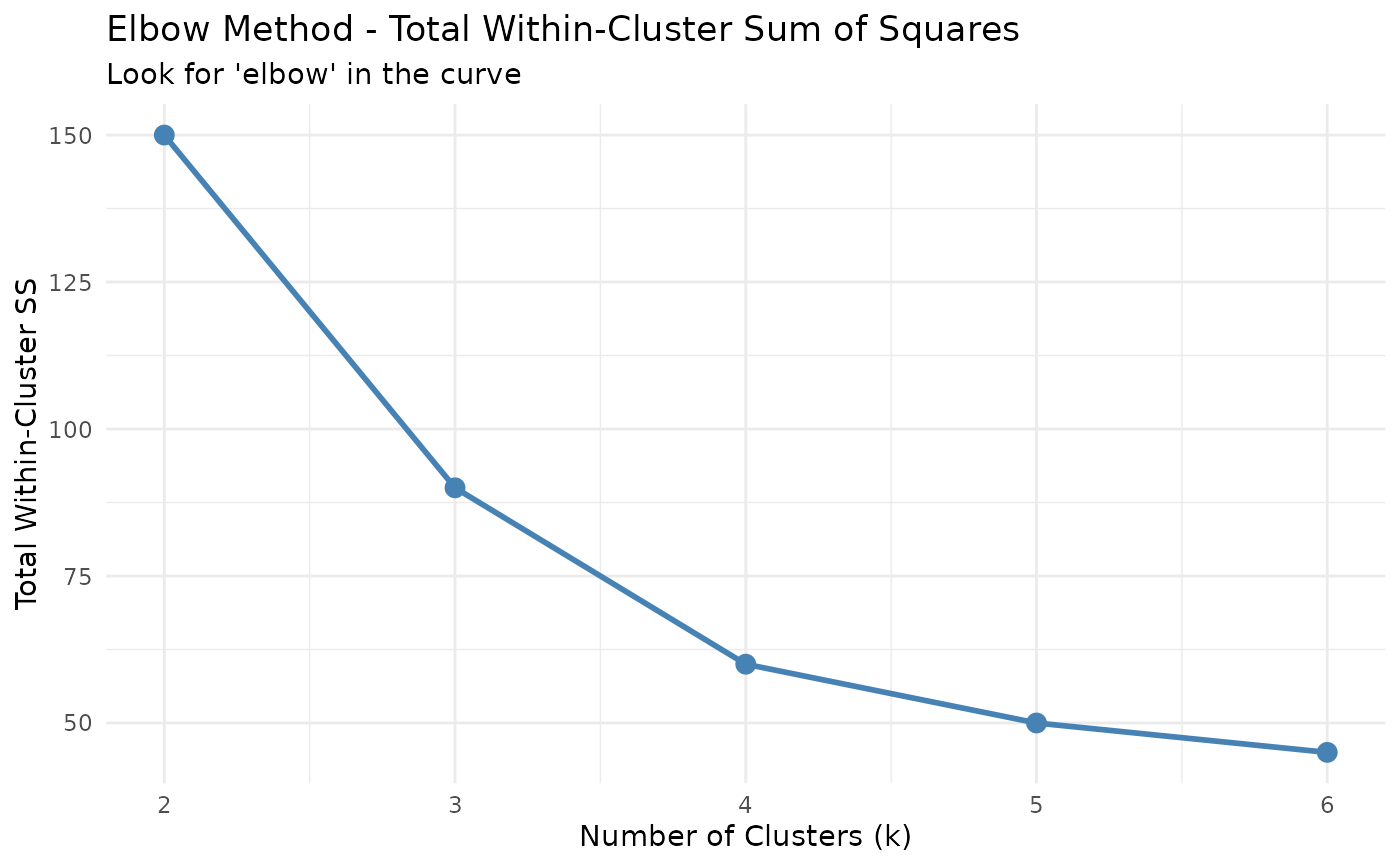
Plot total within-cluster sum of squares vs number of clusters
Value
A ggplot object.
Examples
# \donttest{
wss <- data.frame(k = 2:6, tot_withinss = c(150, 90, 60, 50, 45))
plot_elbow(wss)
 # }
# }
Plot total within-cluster sum of squares vs number of clusters
A ggplot object.
# \donttest{
wss <- data.frame(k = 2:6, tot_withinss = c(150, 90, 60, 50, 45))
plot_elbow(wss)
# }