
Visualize MDS results
Arguments
- mds_obj
A tidy_mds object
- color_by
Optional grouping to colour points by: either a column name present in the MDS configuration, or a vector as long as the data.
- label_points
Logical; add point labels? (default: TRUE)
- dim_x
Which dimension for x-axis (default: 1)
- dim_y
Which dimension for y-axis (default: 2)
Value
A ggplot object.
Examples
# \donttest{
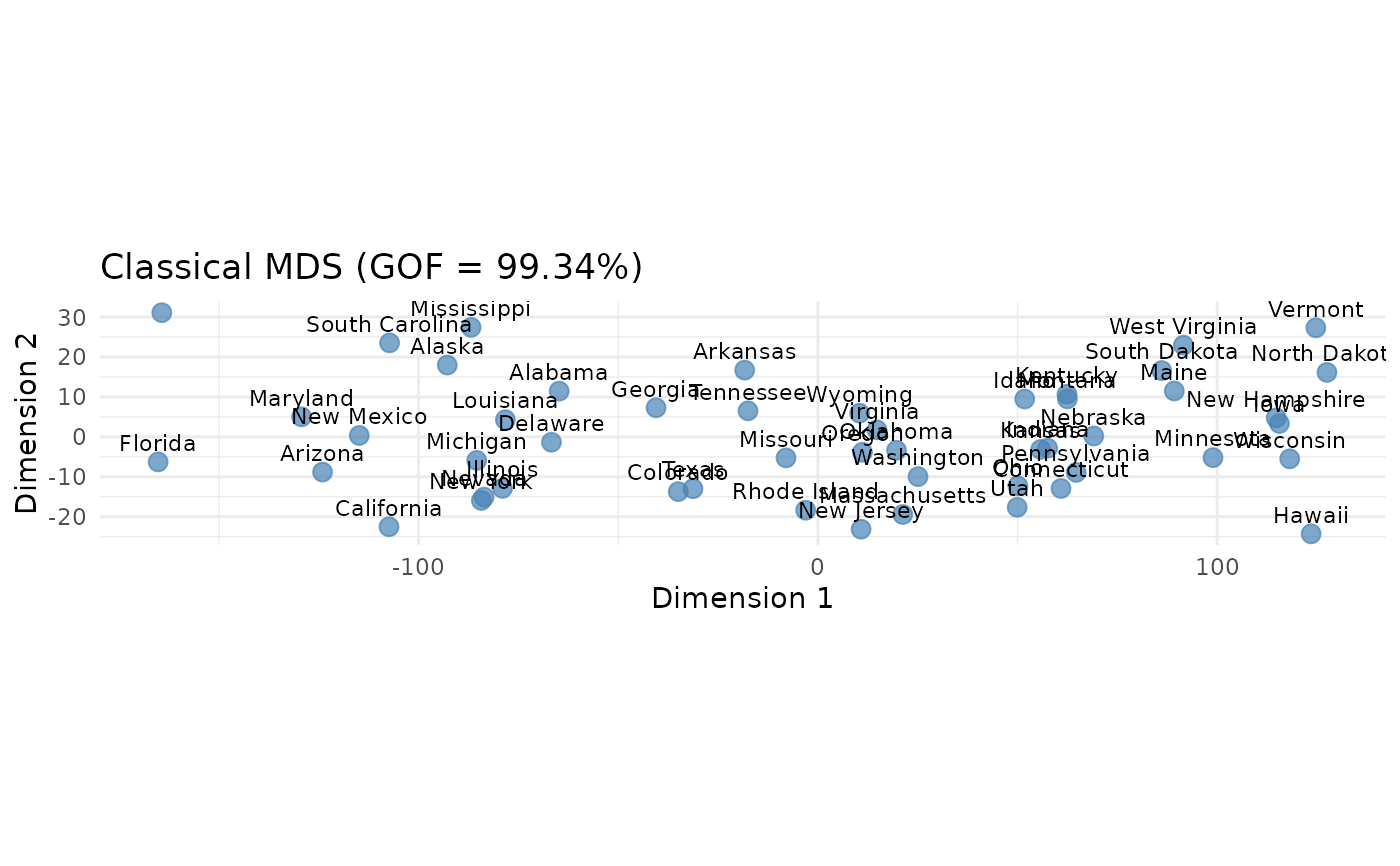
mds <- tidy_mds(USArrests, method = "classical")
plot_mds(mds)
 # }
# }