R/visualization.R
plot_variance_explained.Rd
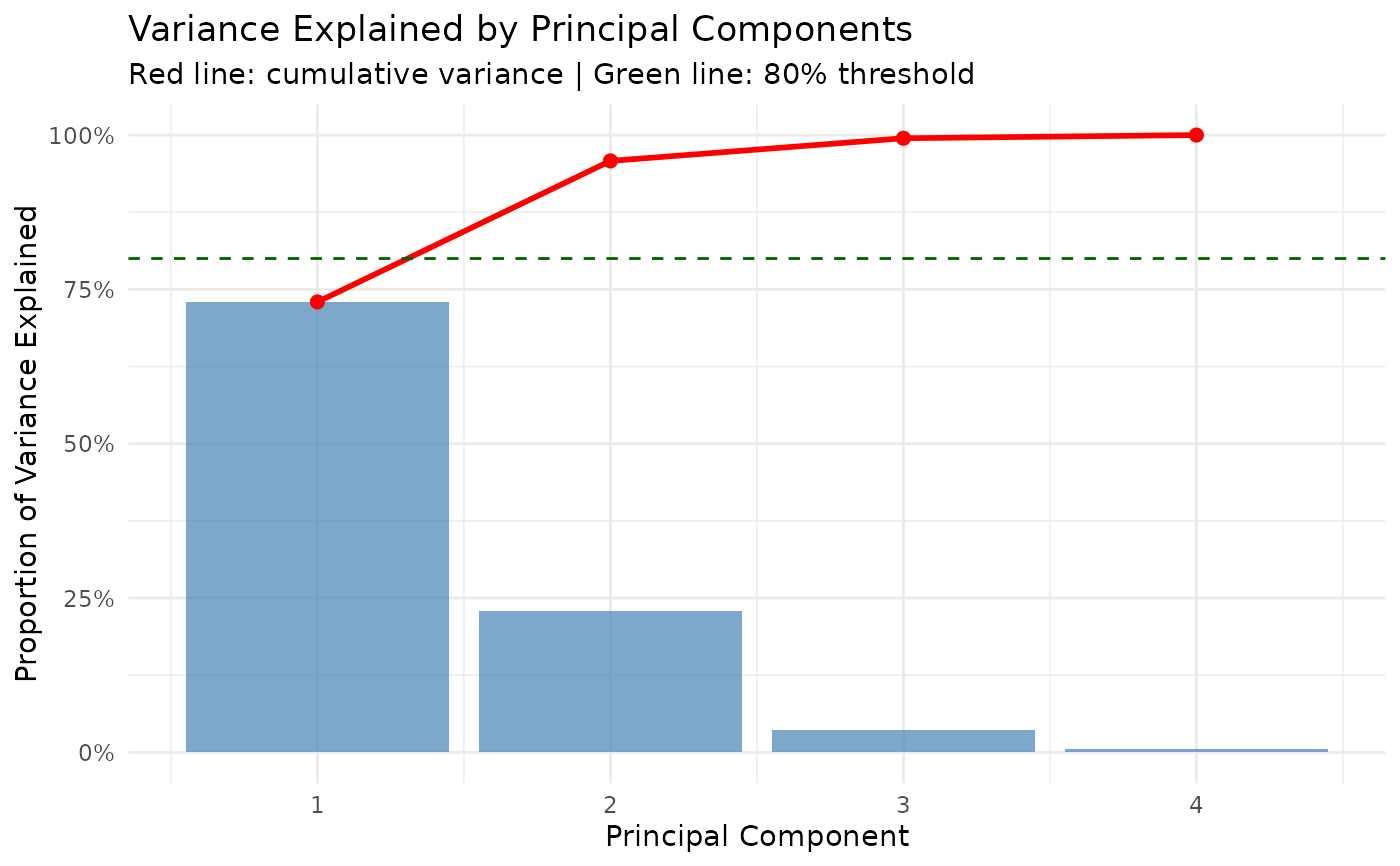
Create combined scree plot showing individual and cumulative variance
plot_variance_explained(variance_tbl, threshold = 0.8)
Variance tibble from tidy_pca
Horizontal line for variance threshold (default: 0.8 for 80%)
A ggplot object.
ggplot
# \donttest{
model <- tl_model(iris[, 1:4], method = "pca")
plot_variance_explained(model$fit$variance_explained)

# }

 # }
# }