
Create dendrogram visualization
Value
The hclust object, returned invisibly. The
dendrogram is plotted as a side effect.
Examples
# \donttest{
hc <- tidy_hclust(USArrests, method = "ward.D2")
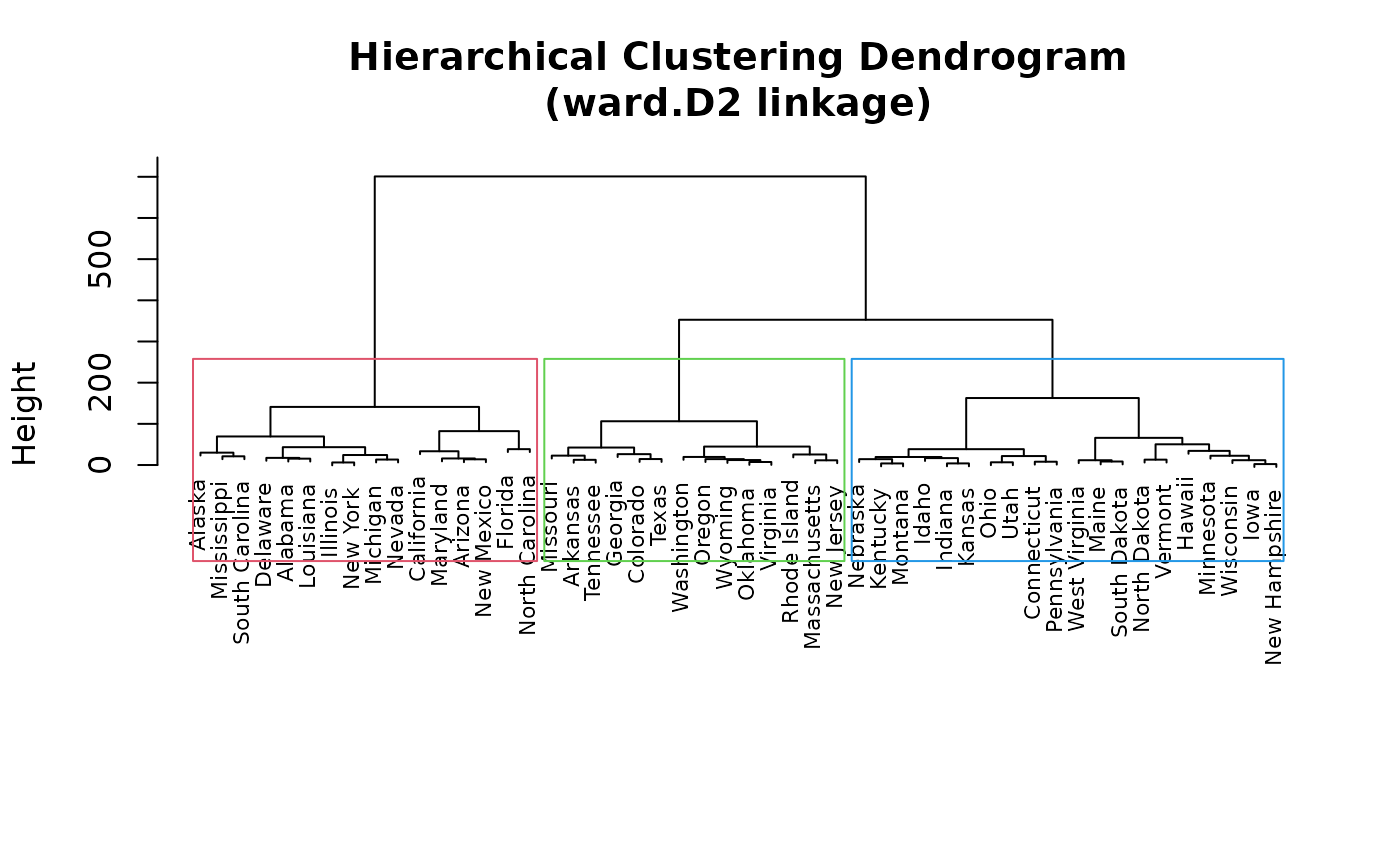
tidy_dendrogram(hc, k = 3)
 # }
# }
Create dendrogram visualization
The hclust object, returned invisibly. The
dendrogram is plotted as a side effect.
# \donttest{
hc <- tidy_hclust(USArrests, method = "ward.D2")
tidy_dendrogram(hc, k = 3)
# }