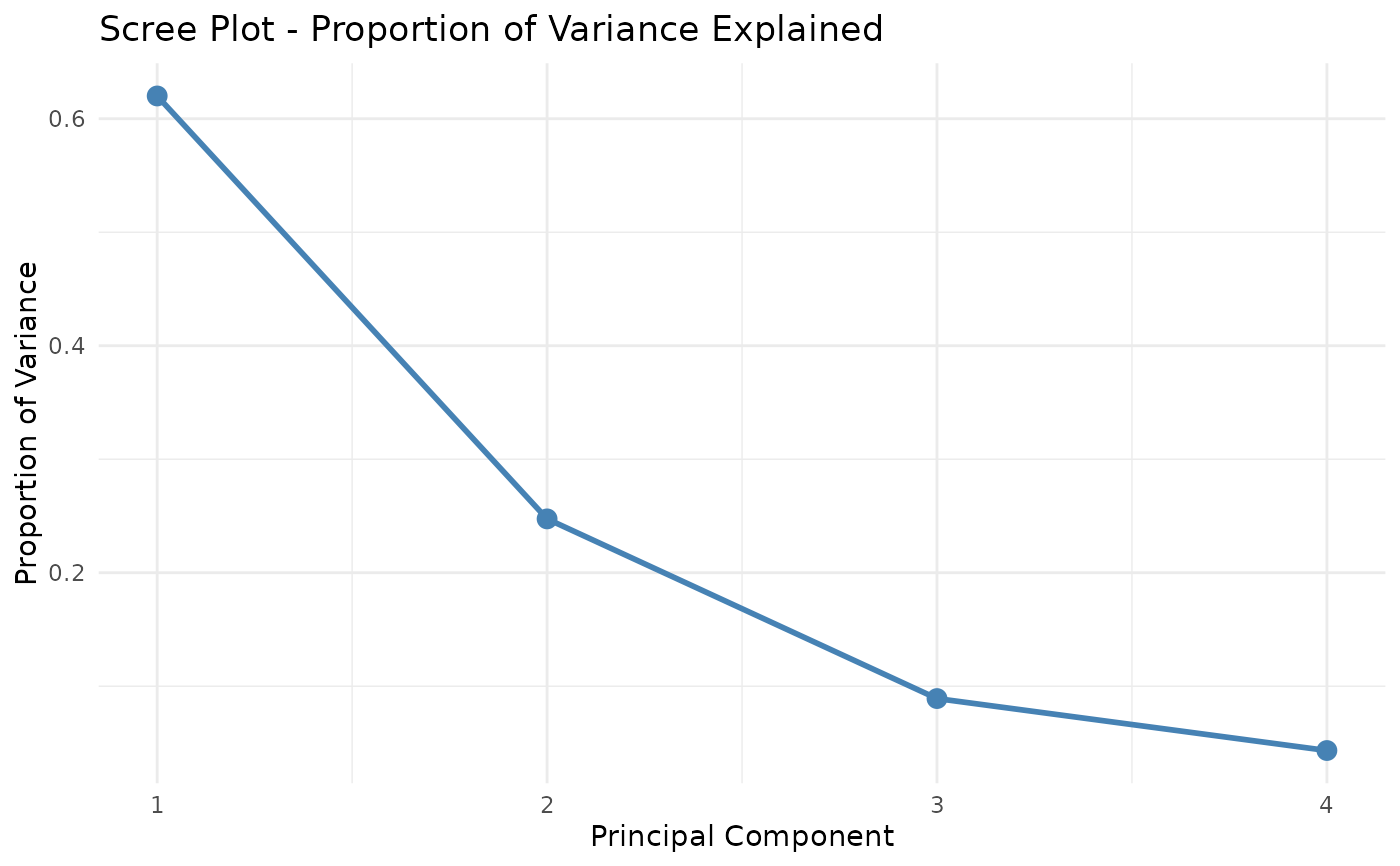
Visualize variance explained by each principal component
Usage
tidy_pca_screeplot(pca_obj, type = "proportion", add_line = TRUE)
Arguments
- pca_obj
A tidy_pca object
- type
Character; "variance" or "proportion" (default)
- add_line
Logical; add horizontal line at
eigenvalue = 1? (for Kaiser criterion)
Examples
# \donttest{
pca <- tidy_pca(USArrests)
tidy_pca_screeplot(pca)
 # }
# }
