
Compare models from a pipeline
Value
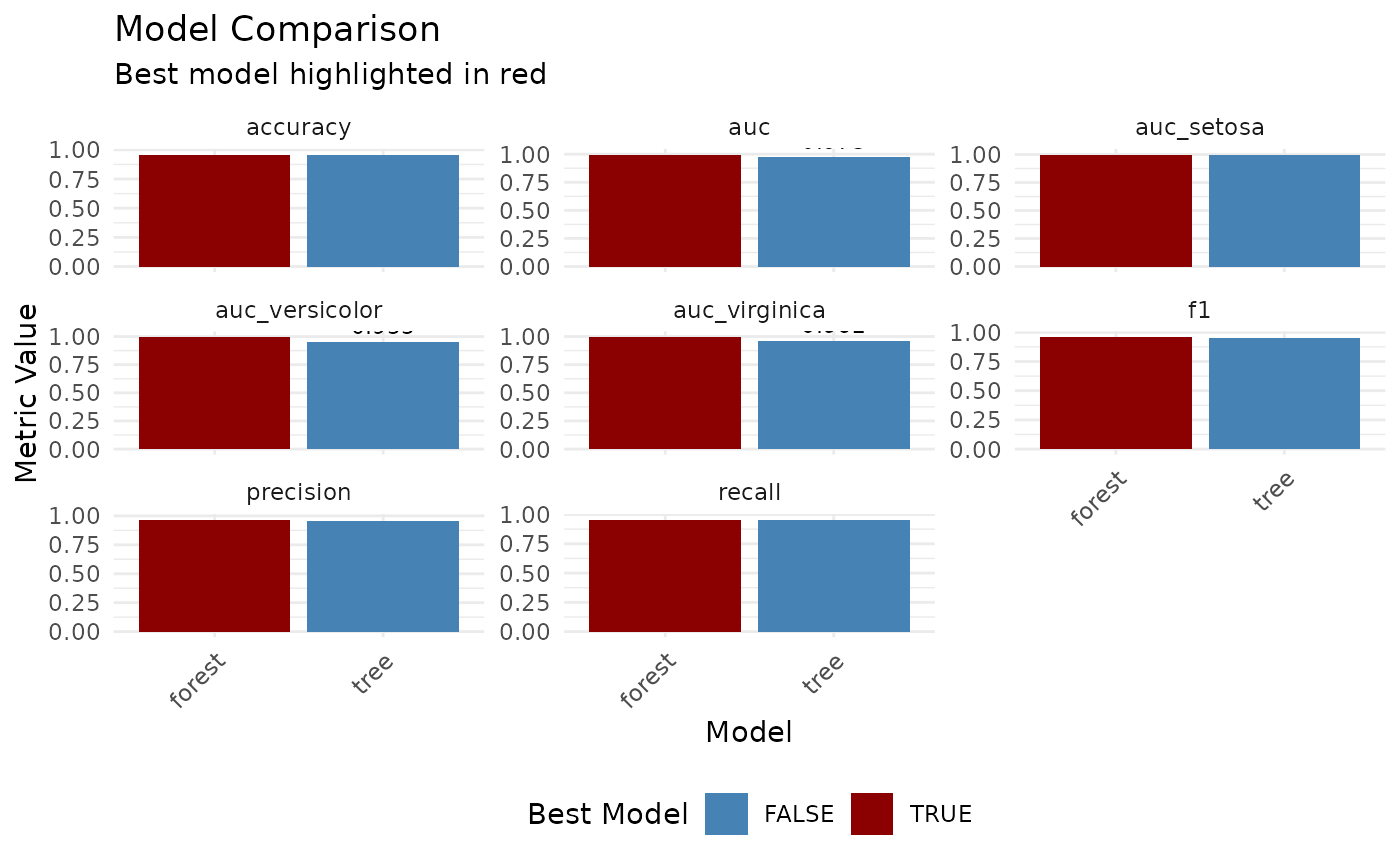
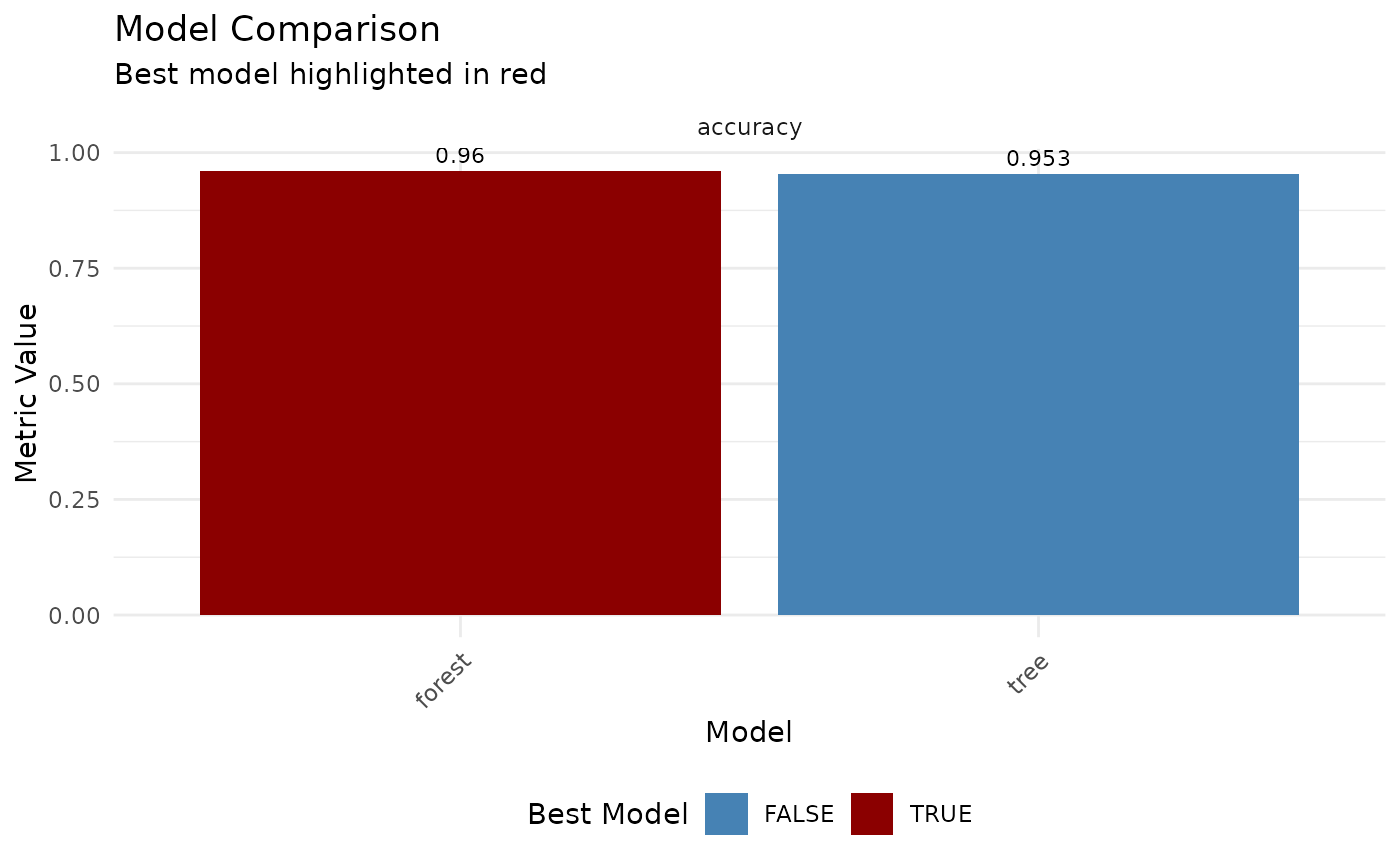
A ggplot object showing a faceted bar
chart comparing metric values across models, with the best model
highlighted.
Examples
# \donttest{
pipe <- tl_pipeline(iris, Species ~ .,
models = list(
tree = list(method = "tree"),
forest = list(method = "forest", ntree = 100)
),
evaluation = list(validation = "cv", cv_folds = 3))
pipe <- tl_run_pipeline(pipe, verbose = FALSE)
tl_compare_pipeline_models(pipe)
 # Restrict the comparison to one metric
tl_compare_pipeline_models(pipe, metrics = "accuracy")
# Restrict the comparison to one metric
tl_compare_pipeline_models(pipe, metrics = "accuracy")
 # }
# }