
Create a comprehensive diagnostic dashboard
Usage
tl_diagnostic_dashboard(
  model,
  include_influence = TRUE,
  include_assumptions = TRUE,
  include_performance = TRUE,
  arrange_plots = "grid"
)Value
A grid.arrange object (a
grob) containing the arranged diagnostic plots.
Examples
# \donttest{
if (requireNamespace("gridExtra")) {
model <- tl_model(mtcars, mpg ~ wt + hp, method = "linear")
tl_diagnostic_dashboard(model)
}
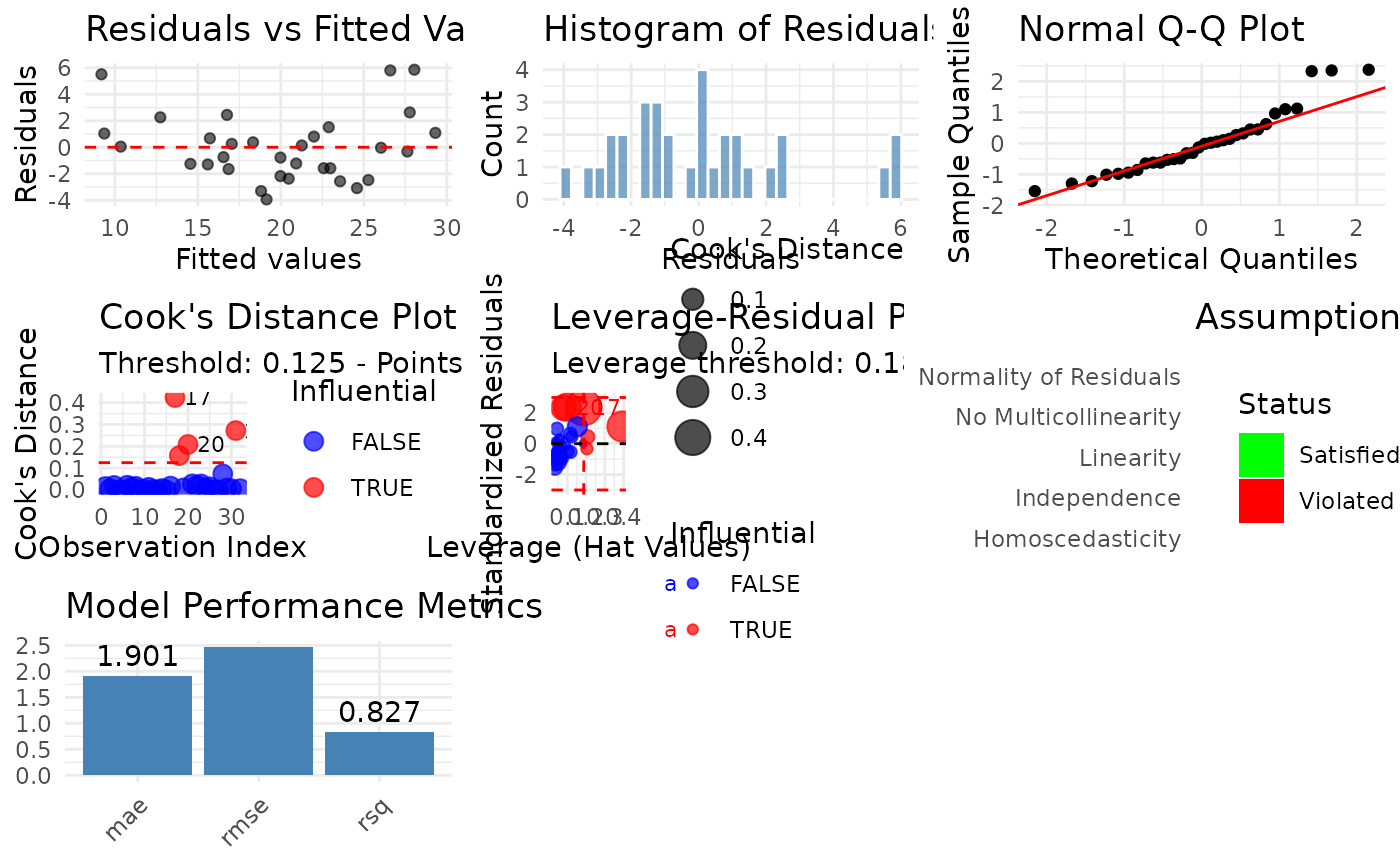 #> TableGrob (3 x 3) "arrange": 7 grobs
#> z cells name grob
#> residuals_vs_fitted 1 (1-1,1-1) arrange gtable[layout]
#> residual_hist 2 (1-1,2-2) arrange gtable[layout]
#> qq_plot 3 (1-1,3-3) arrange gtable[layout]
#> cook_distance 4 (2-2,1-1) arrange gtable[layout]
#> leverage_plot 5 (2-2,2-2) arrange gtable[layout]
#> assumptions 6 (2-2,3-3) arrange gtable[layout]
#> performance 7 (3-3,1-1) arrange gtable[layout]
# }
#> TableGrob (3 x 3) "arrange": 7 grobs
#> z cells name grob
#> residuals_vs_fitted 1 (1-1,1-1) arrange gtable[layout]
#> residual_hist 2 (1-1,2-2) arrange gtable[layout]
#> qq_plot 3 (1-1,3-3) arrange gtable[layout]
#> cook_distance 4 (2-2,1-1) arrange gtable[layout]
#> leverage_plot 5 (2-2,2-2) arrange gtable[layout]
#> assumptions 6 (2-2,3-3) arrange gtable[layout]
#> performance 7 (3-3,1-1) arrange gtable[layout]
# }