
Comprehensive EDA combining unsupervised learning techniques to understand data structure before modeling
Value
A list with class "tidylearn_eda" containing:
- data
The original data frame.
- response
The response variable name, or
NULL.- pca
The fitted PCA model.
- optimal_k
List with optimal cluster count results.
- kmeans
The fitted k-means model.
- hclust
The fitted hierarchical clustering model.
- summary
List with
n_obs,n_vars,n_components, andbest_k.
Examples
# \donttest{
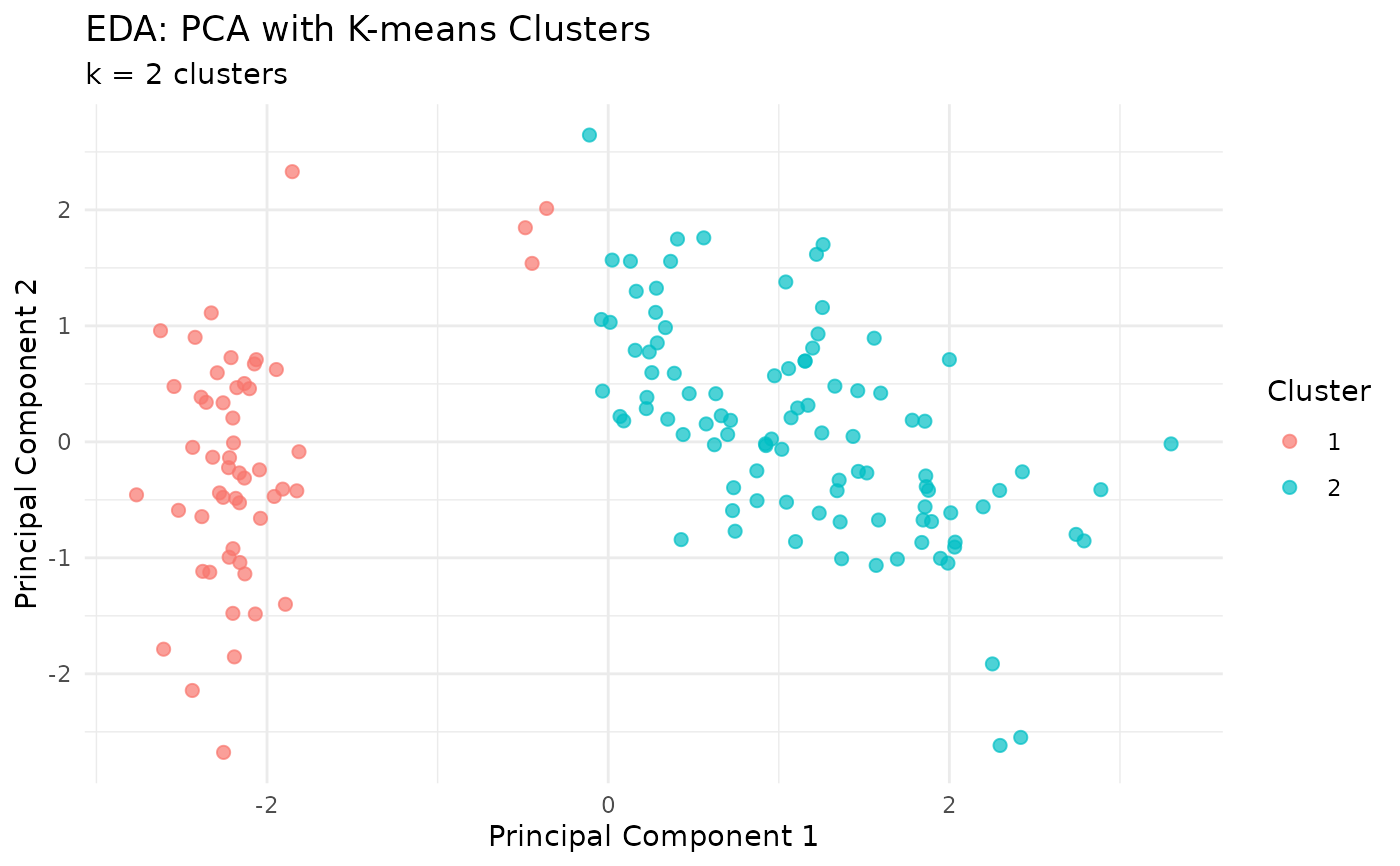
eda <- tl_explore(iris, response = "Species")
#> Running Exploratory Data Analysis...
#> [1/4] PCA analysis...
#> [2/4] Finding optimal clusters...
#> [3/4] Clustering analysis...
#> [4/4] Distance analysis...
#> EDA complete!
plot(eda)
 # }
# }