
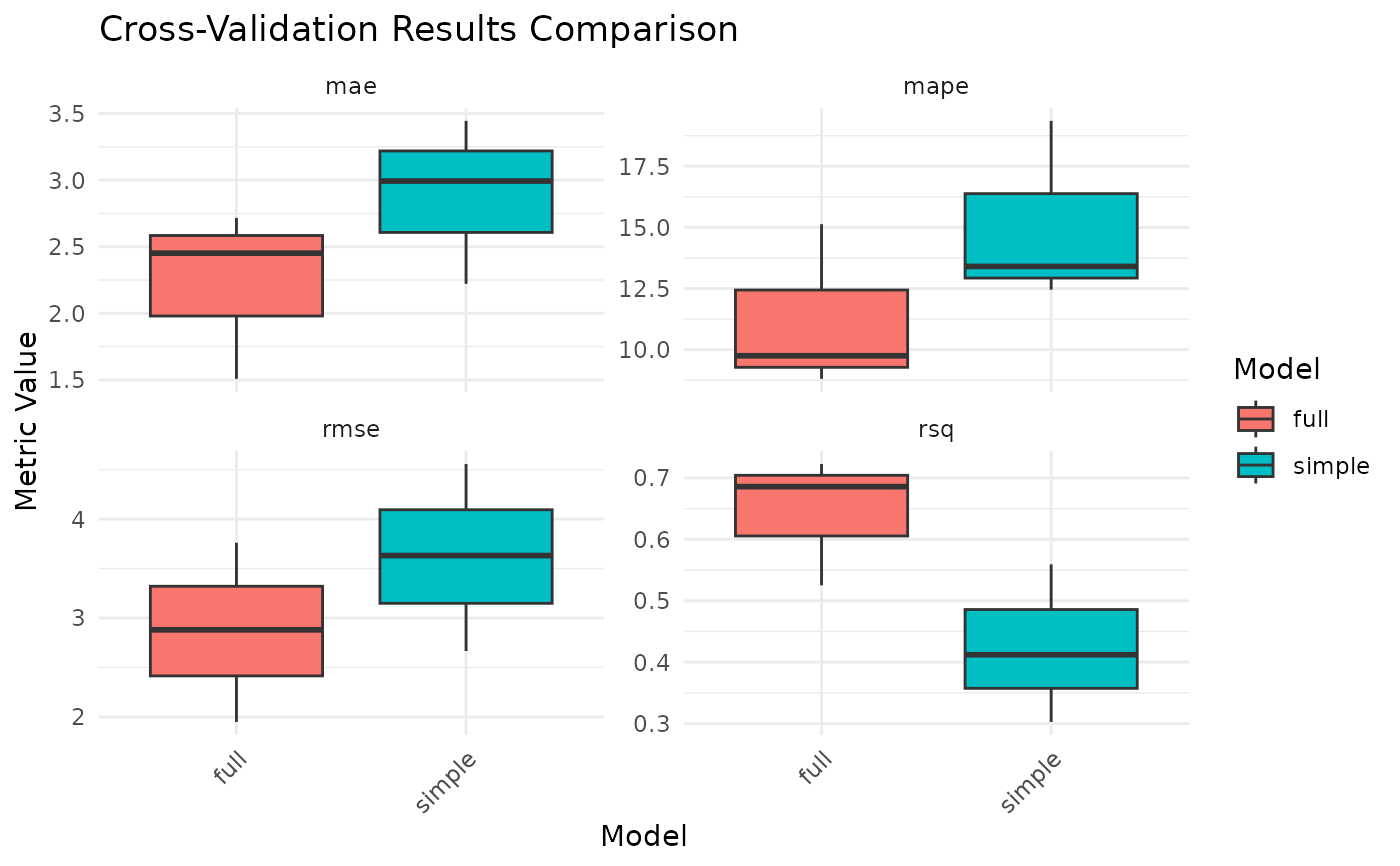
Plot comparison of cross-validation results
Value
A ggplot object showing boxplots of
cross-validation metric distributions for each model.
Examples
# \donttest{
m1 <- tl_model(mtcars, mpg ~ wt, method = "linear")
m2 <- tl_model(mtcars, mpg ~ wt + hp, method = "linear")
cv <- tl_compare_cv(mtcars, list(simple = m1, full = m2), folds = 3)
tl_plot_cv_comparison(cv)
 # }
# }