
Plot variable importance for a regularized model
Source:R/supervised-regularization.R
tl_plot_importance_regularized.RdPlot variable importance for a regularized model
Value
A ggplot object.
Examples
# \donttest{
model <- tl_model(mtcars, mpg ~ ., method = "lasso")
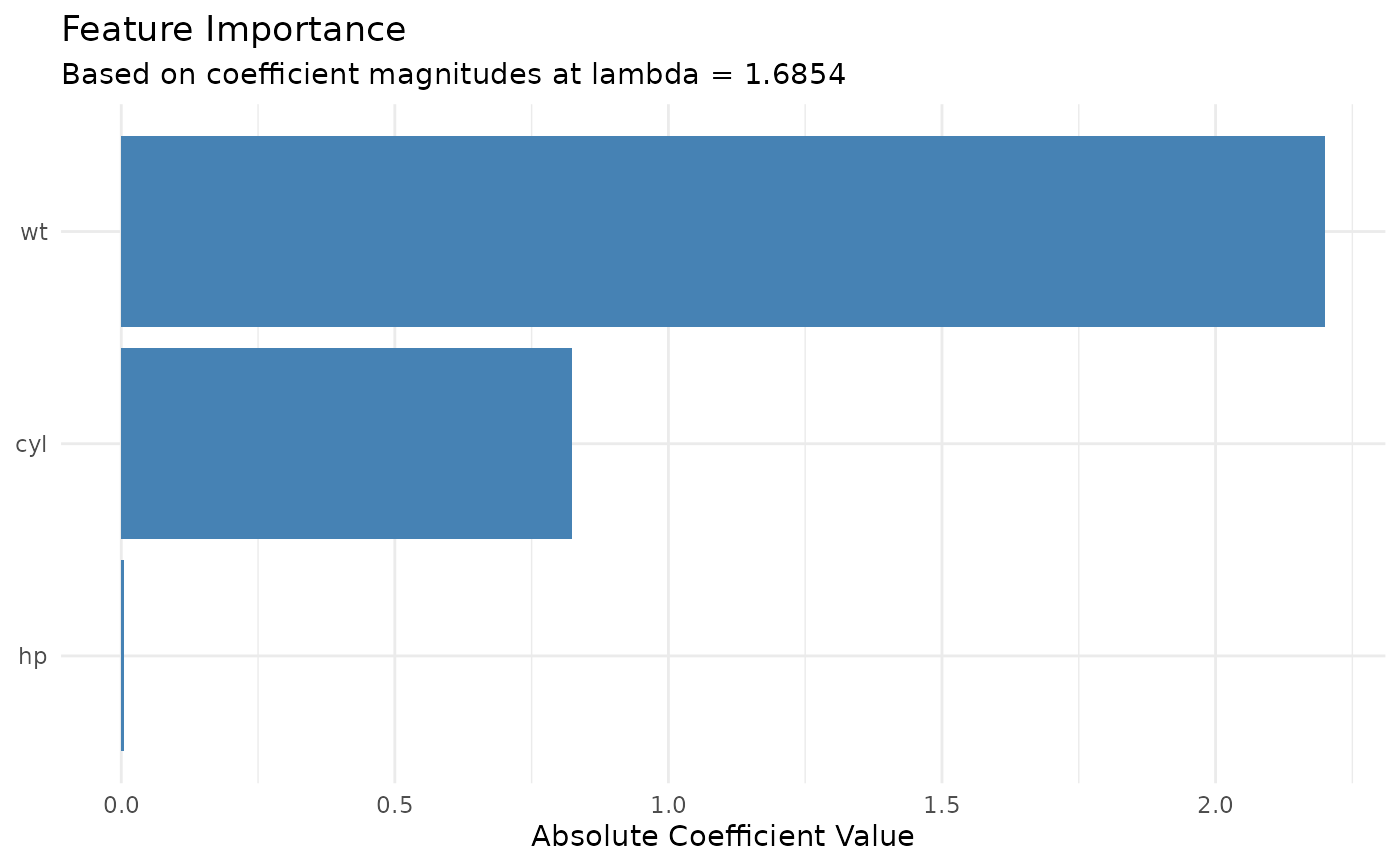
tl_plot_importance_regularized(model)
 # }
# }