
Plot influence diagnostics
Usage
tl_plot_influence(
  model,
  plot_type = "cook",
  threshold_cook = NULL,
  threshold_leverage = NULL,
  threshold_dffits = NULL,
  n_labels = 3,
  label_size = 3
)
Arguments
- model
A tidylearn model object
- plot_type
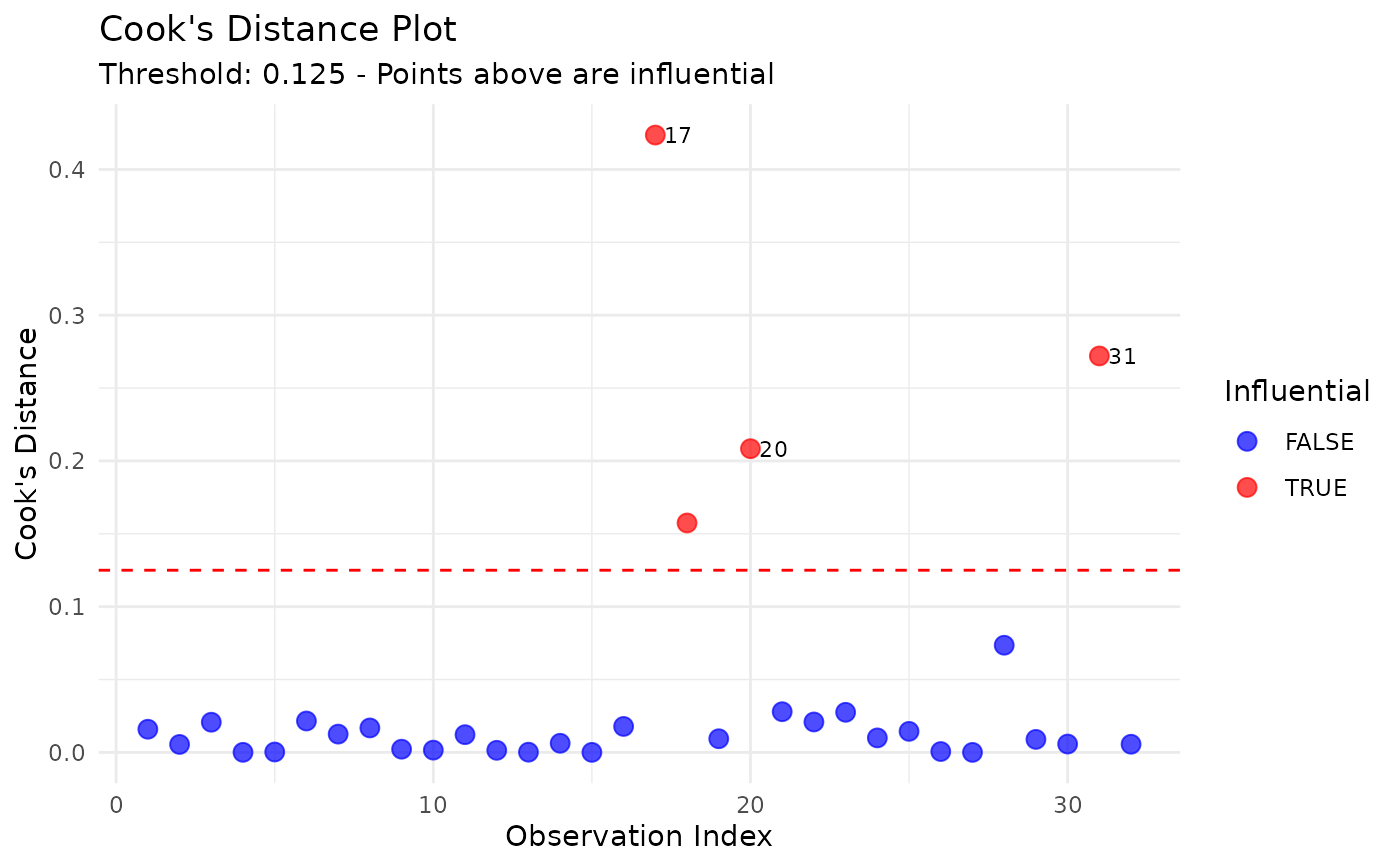
Type of influence plot: "cook", "leverage", "index"
- threshold_cook
Cook's distance threshold (default: 4/n)
- threshold_leverage
Leverage threshold (default: 2*(p+1)/n)
- threshold_dffits
DFFITS threshold (default: 2*sqrt((p+1)/n))
- n_labels
Number of points to label (default: 3)
- label_size
Text size for labels (default: 3)
Value
A ggplot object.
Examples
# \donttest{
model <- tl_model(mtcars, mpg ~ wt + hp, method = "linear")
tl_plot_influence(model, plot_type = "cook")
 # }
# }