
Plot interaction effects
Usage
tl_plot_interaction(
  model,
  var1,
  var2,
  n_points = 100,
  fixed_values = NULL,
  confidence = TRUE,
  ...
)
Arguments
- model
A tidylearn model object
- var1
First variable in the interaction
- var2
Second variable in the interaction
- n_points
Number of points to use for continuous variables
- fixed_values
Named list of values for other variables in the model
- confidence
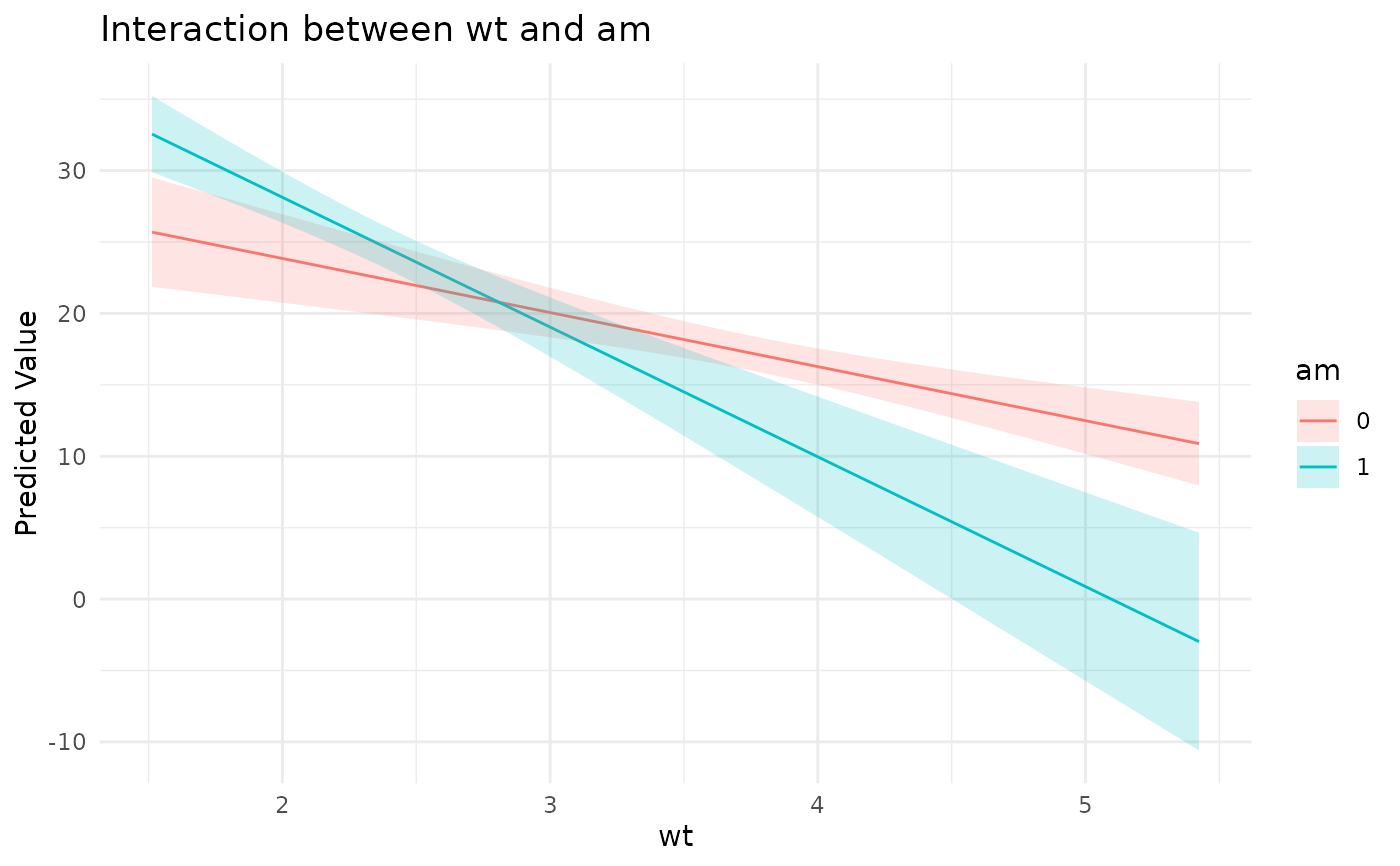
Logical; whether to show a 95\ band is drawn when one variable is numeric and the other categorical, and needs a model whose underlying fit is an
lmorglm; for aglmit is built on the link scale and transformed to the response scale. For any other fit a message says no band was drawn.- ...
Additional arguments to pass to predict()
Value
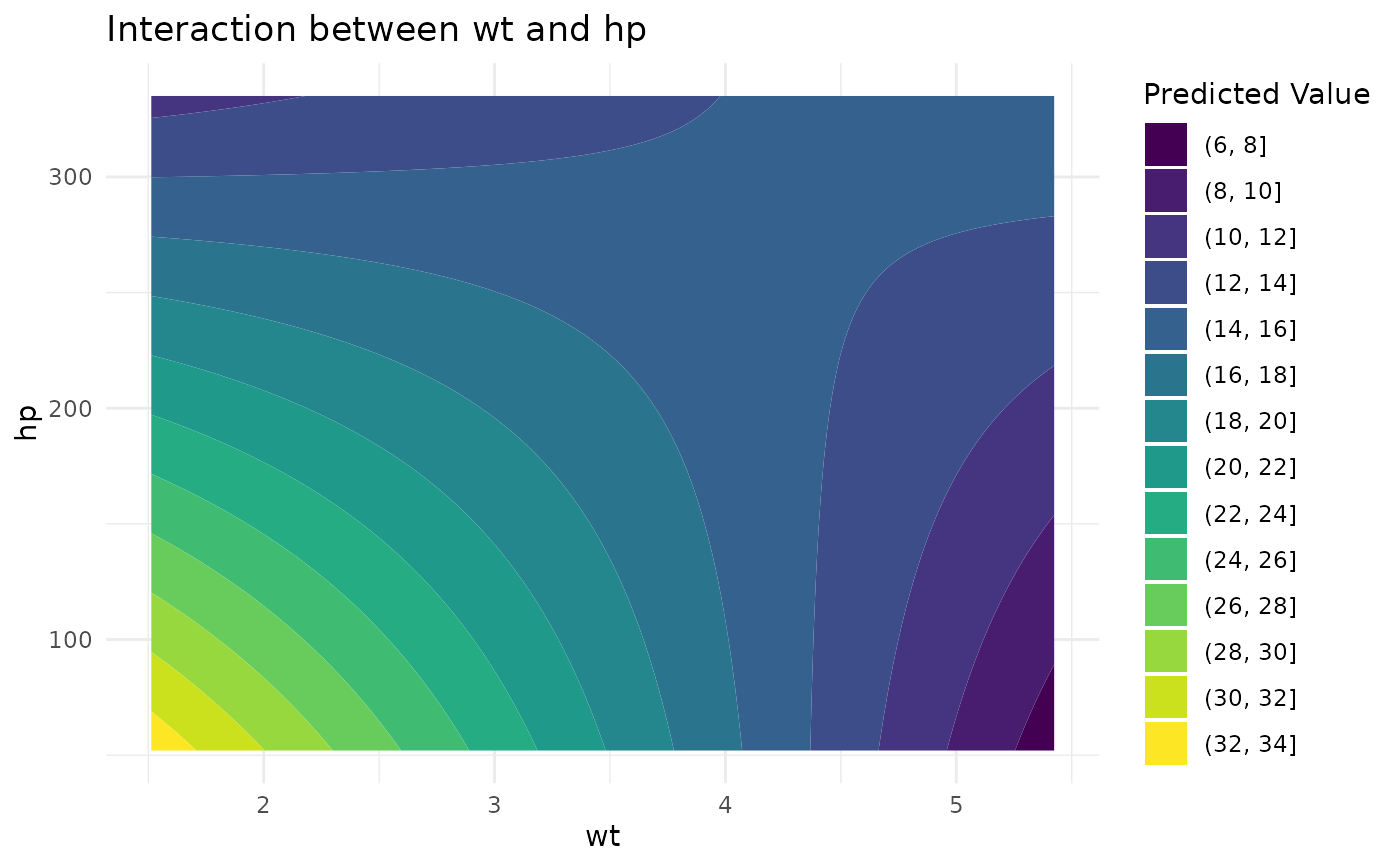
A ggplot object. Two numeric variables are
drawn as a filled contour of the prediction; a numeric and a categorical
variable as one line per category; two categorical variables as dodged
bars.
Examples
# \donttest{
model <- tl_model(mtcars, mpg ~ wt * hp, method = "linear")
# Two numeric variables are drawn as a filled contour over both ranges
tl_plot_interaction(model, var1 = "wt", var2 = "hp")
 # A numeric by categorical interaction is drawn as one line per level,
# each with a confidence band
am_model <- tl_model(transform(mtcars, am = factor(am)), mpg ~ wt * am,
method = "linear")
tl_plot_interaction(am_model, var1 = "wt", var2 = "am")
# A numeric by categorical interaction is drawn as one line per level,
# each with a confidence band
am_model <- tl_model(transform(mtcars, am = factor(am)), mpg ~ wt * am,
method = "linear")
tl_plot_interaction(am_model, var1 = "wt", var2 = "am")
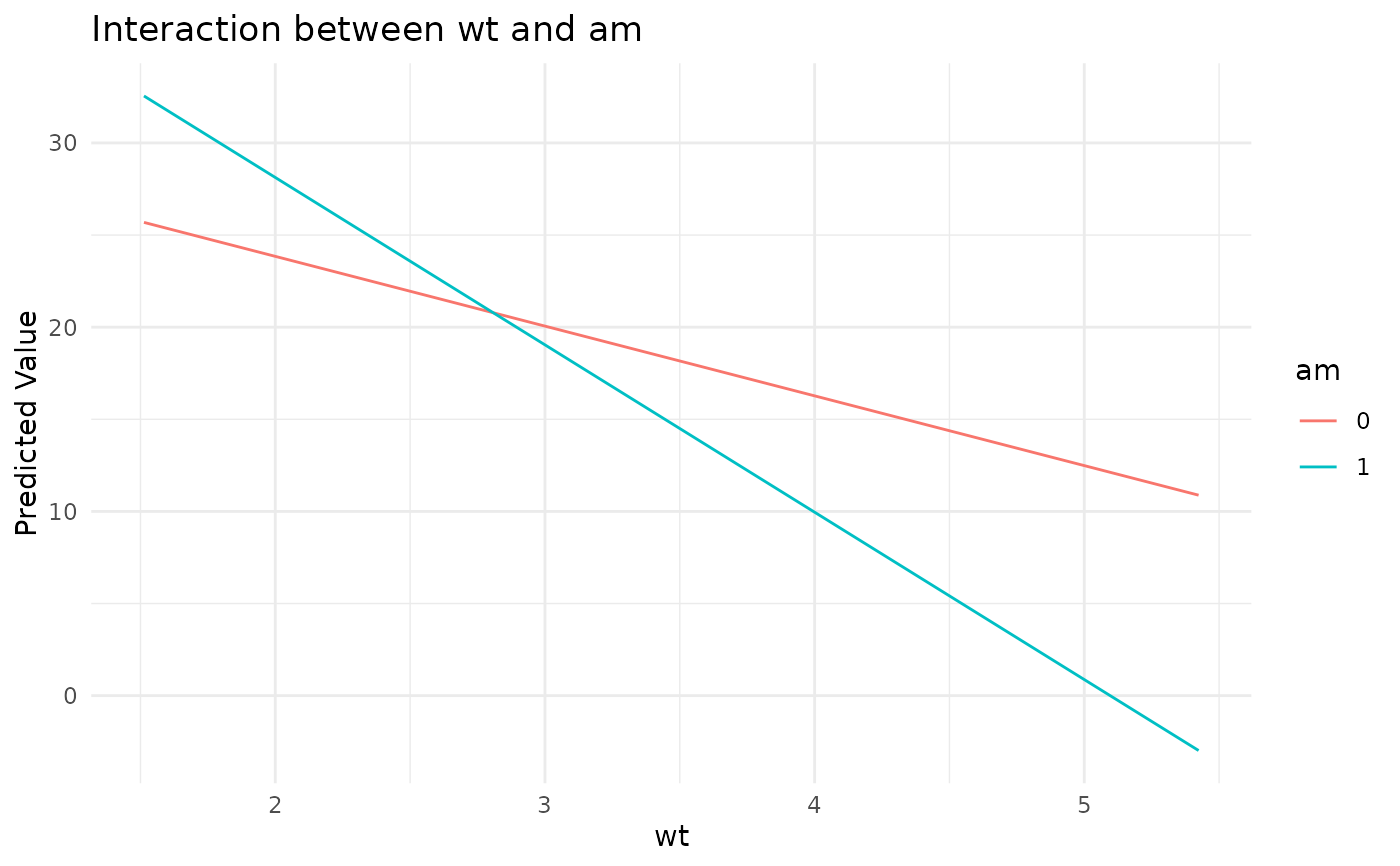
 # Coarser grid, no band
tl_plot_interaction(am_model, var1 = "wt", var2 = "am",
n_points = 20, confidence = FALSE)
# Coarser grid, no band
tl_plot_interaction(am_model, var1 = "wt", var2 = "am",
n_points = 20, confidence = FALSE)
 # }
# }