
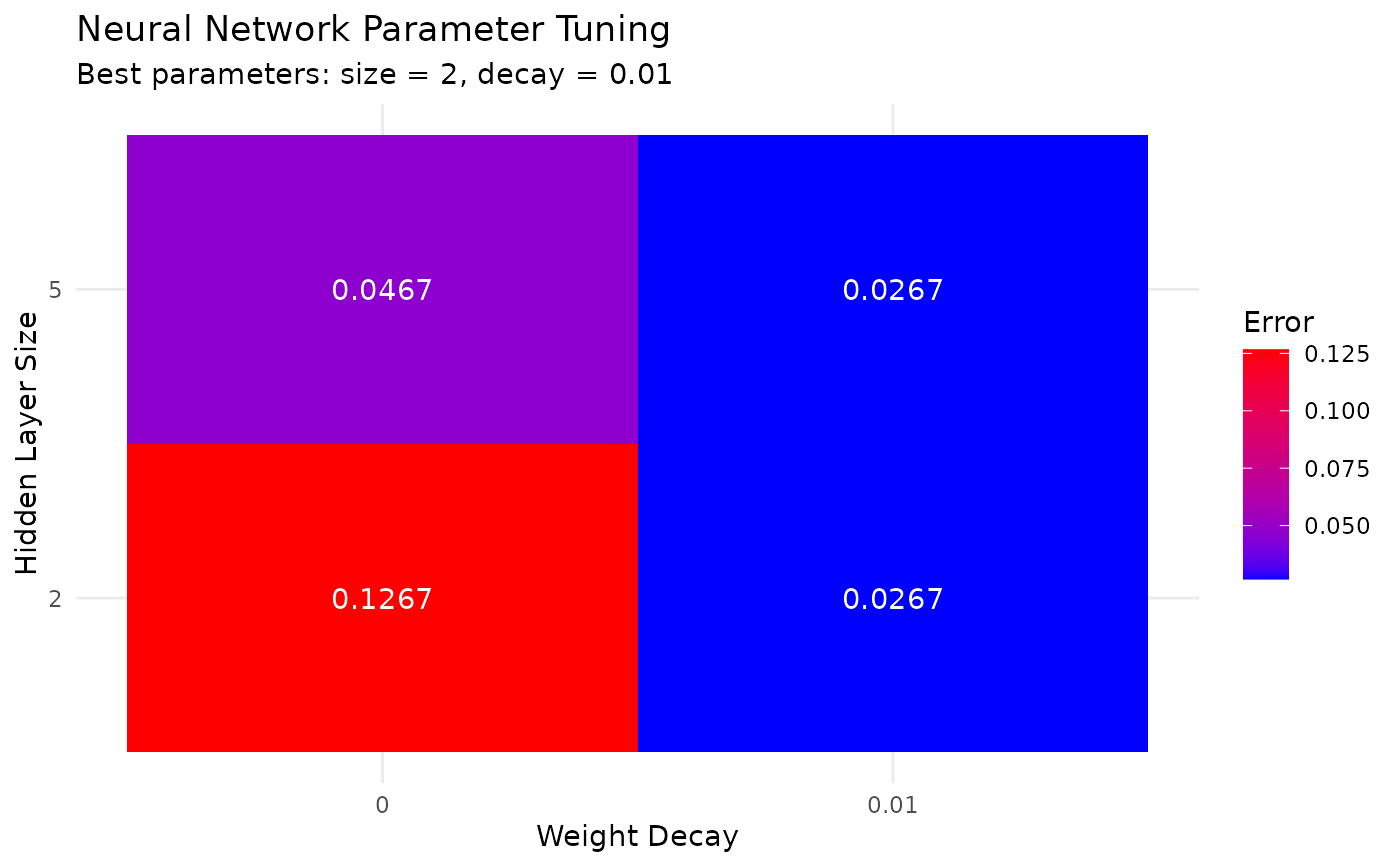
Draws the size-by-decay grid as a heatmap of cross-validated error.
Arguments
- model
The list returned by
tl_tune_nn, not a fitted model — the grid it draws lives in that list's$tuning_results. Anything without that element is refused.- ...
Additional arguments
Value
A ggplot object.
Examples
# \donttest{
tuned <- tl_tune_nn(iris, Species ~ .,
is_classification = TRUE,
sizes = c(2, 5), decays = c(0, 0.01), folds = 3)
# The tuning result itself, not tuned$model
tl_plot_nn_tuning(tuned)
 # }
# }