
Skip to contents

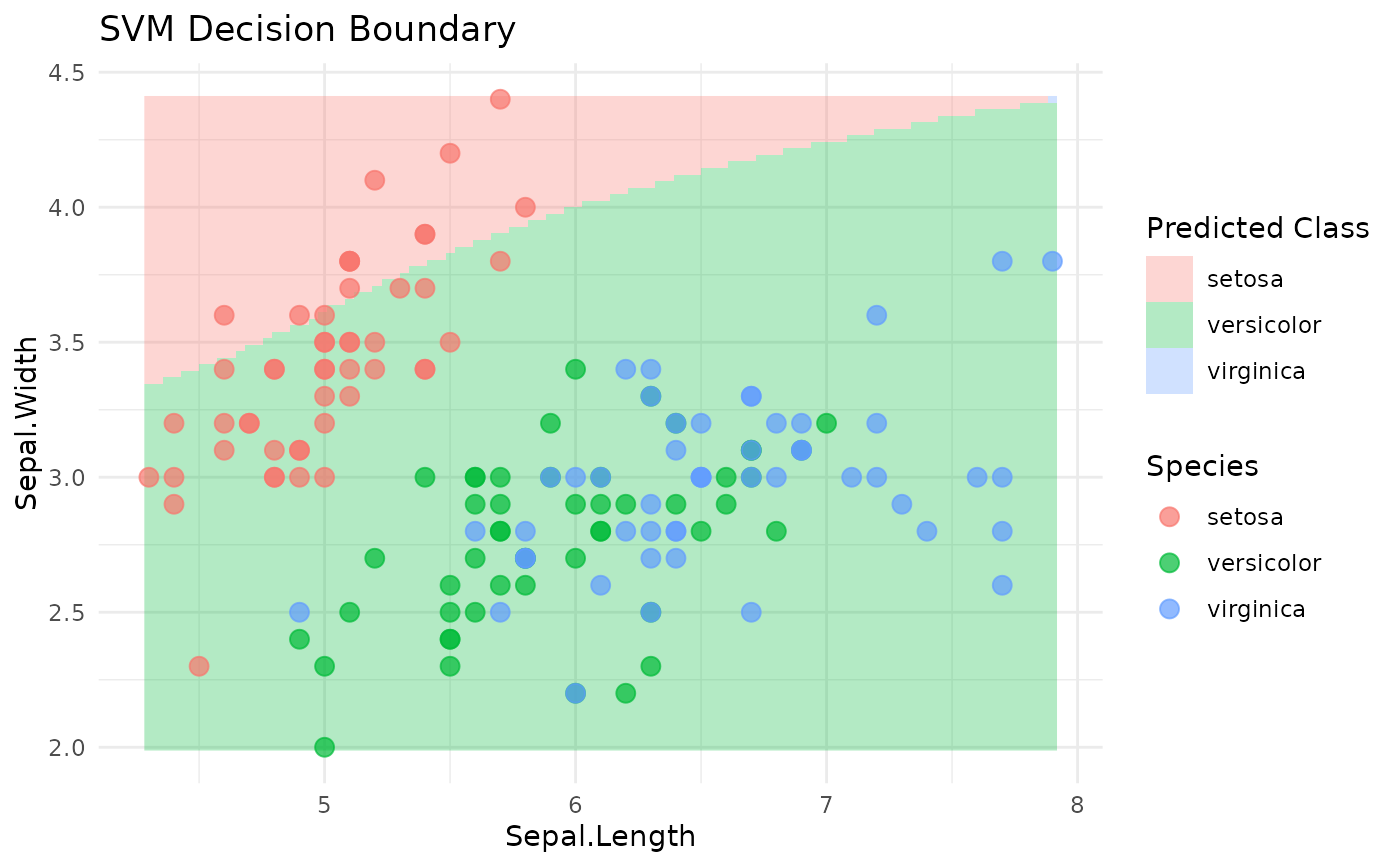
Plot SVM decision boundary

Usage

tl_plot_svm_boundary(model, x_var = NULL, y_var = NULL, grid_size = 100, ...)

Arguments

model

A tidylearn SVM model object

x_var

Name of the x-axis variable

y_var

Name of the y-axis variable

grid_size

Number of points in each dimension for the grid (default: 100)

...

Additional arguments

Value

A ggplot object.

Examples

# \donttest{
if (requireNamespace("e1071", quietly = TRUE)) {
  model <- tl_model(iris, Species ~ ., method = "svm")
  tl_plot_svm_boundary(model,
    x_var = "Sepal.Length", y_var = "Sepal.Width")
}
# }