
Plot hyperparameter tuning results
Usage
tl_plot_tuning_results(
  model,
  top_n = 5,
  param1 = NULL,
  param2 = NULL,
  plot_type = "scatter"
)Value
A ggplot object.
Examples
# \donttest{
model <- tl_tune_grid(iris, Species ~ ., method = "tree",
param_grid = list(cp = c(0.01, 0.1), minsplit = c(10, 20)),
folds = 2, verbose = FALSE)
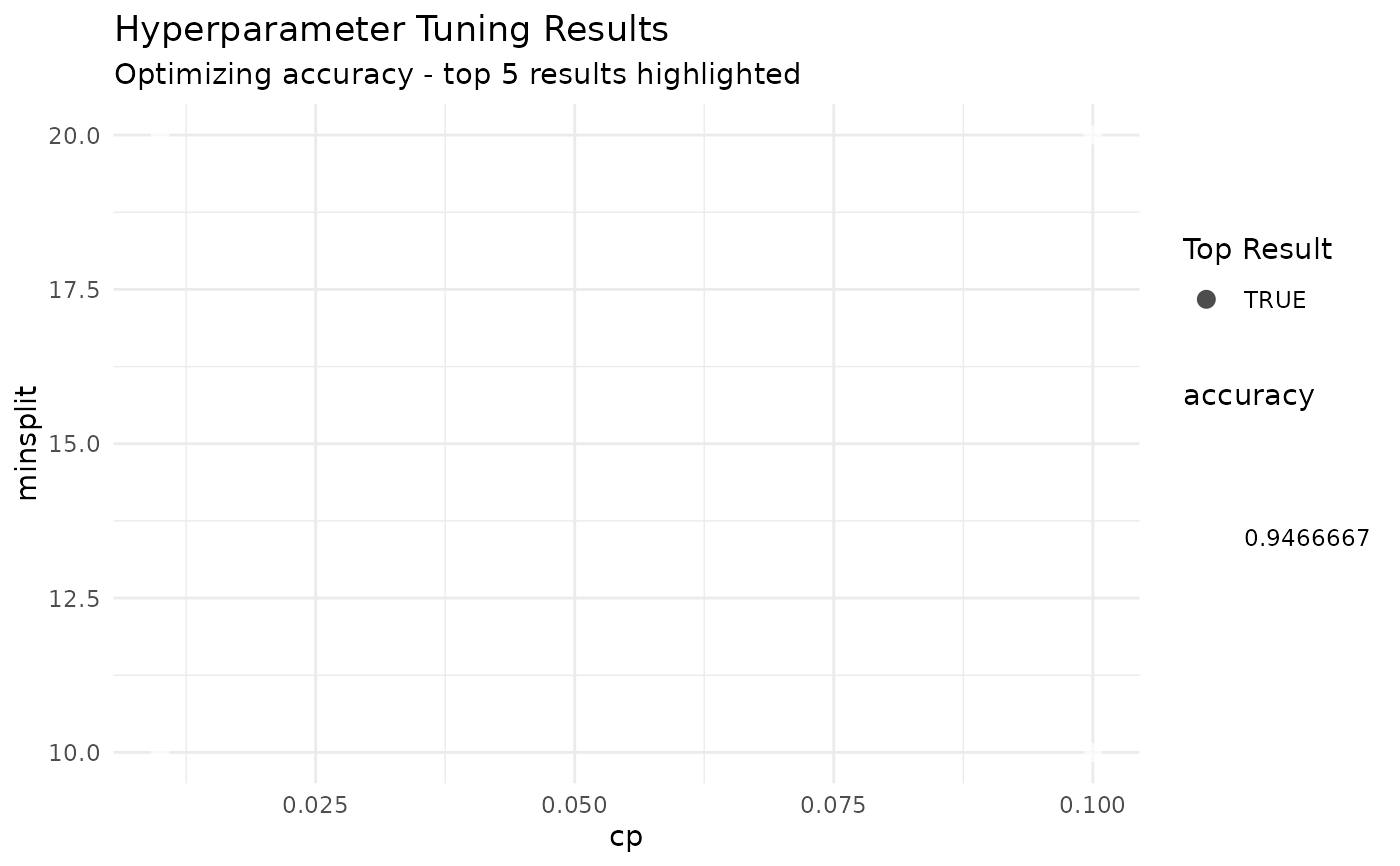
tl_plot_tuning_results(model)
 # }
# }