
Plot feature importance for an XGBoost model
Source:R/supervised-xgboost.R
tl_plot_xgboost_importance.RdPlot feature importance for an XGBoost model
Arguments
- model
A tidylearn XGBoost model object
- top_n
Number of top features to display (default: 10)
- importance_type
Type of importance: "gain" (default), "cover", "frequency" or "weight", read from the matching column of
xgboost::xgb.importance(). A linear booster (booster = "gblinear") reports only "weight", its coefficients, which it uses whenimportance_typeis left out; they are ranked by size, and for a multiclass model by their mean size over the classes. A coefficient's size depends on its predictor's scale.- ...
Additional arguments passed to
xgboost::xgb.importance()
Value
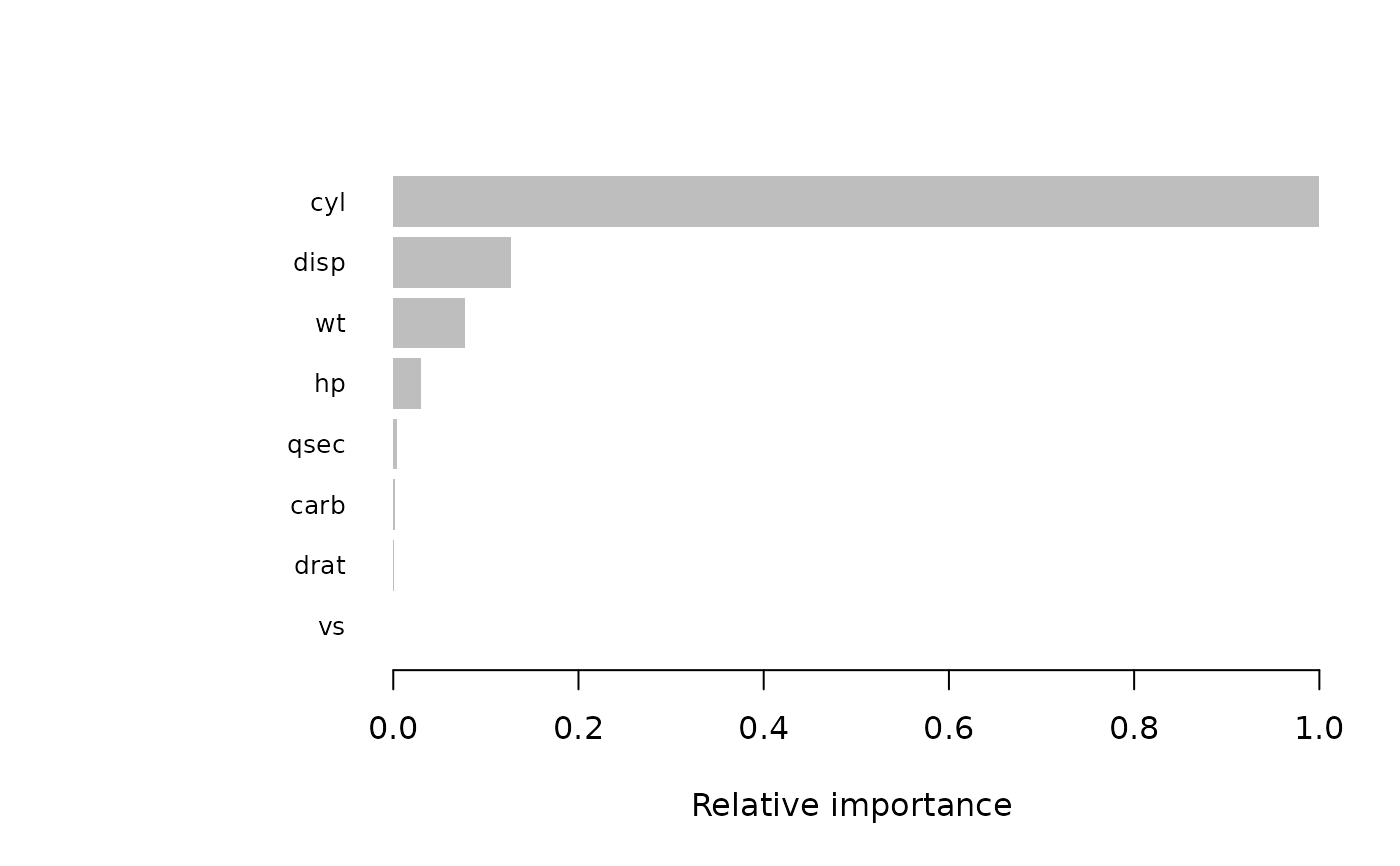
A ggplot object. Its data holds the
top_n features and their importance, relative to the
most important feature's.
Examples
# \donttest{
if (requireNamespace("xgboost", quietly = TRUE)) {
model <- tl_model(mtcars, mpg ~ ., method = "xgboost", nthread = 2)
tl_plot_xgboost_importance(model)
}
 # }