
Plot SHAP dependence for a specific feature
Source:R/supervised-xgboost.R
tl_plot_xgboost_shap_dependence.RdPlot SHAP dependence for a specific feature
Usage
tl_plot_xgboost_shap_dependence(
  model,
  feature,
  interaction_feature = NULL,
  data = NULL,
  n_samples = 100
)Value
A ggplot object.
Examples
# \donttest{
if (requireNamespace("xgboost", quietly = TRUE)) {
model <- tl_model(iris, Species ~ ., method = "xgboost", nrounds = 10)
tl_plot_xgboost_shap_dependence(model, feature = "Petal.Length")
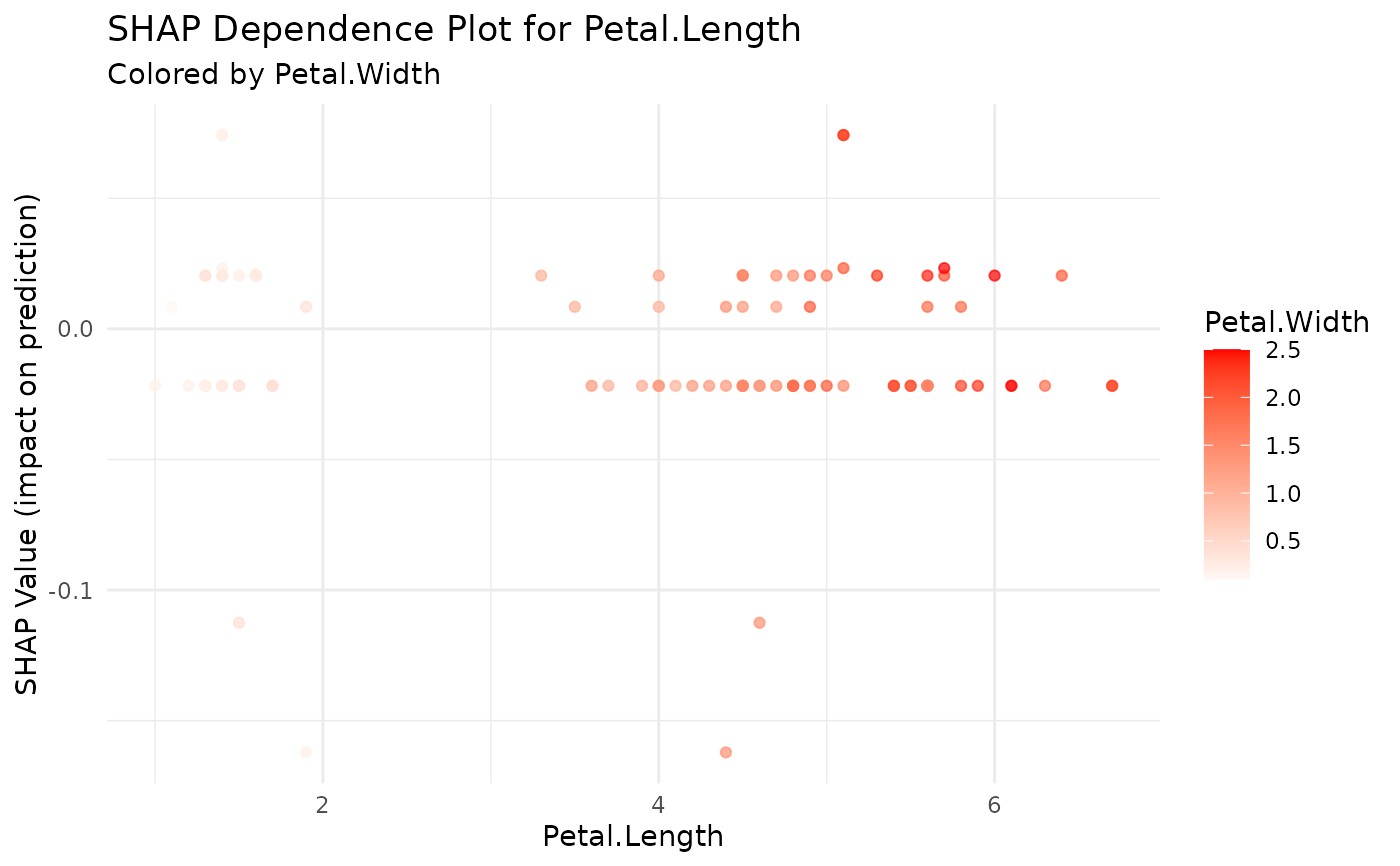
# Colour the points by a second feature to read the interaction
tl_plot_xgboost_shap_dependence(model,
feature = "Petal.Length",
interaction_feature = "Petal.Width")
}
 # }
# }