
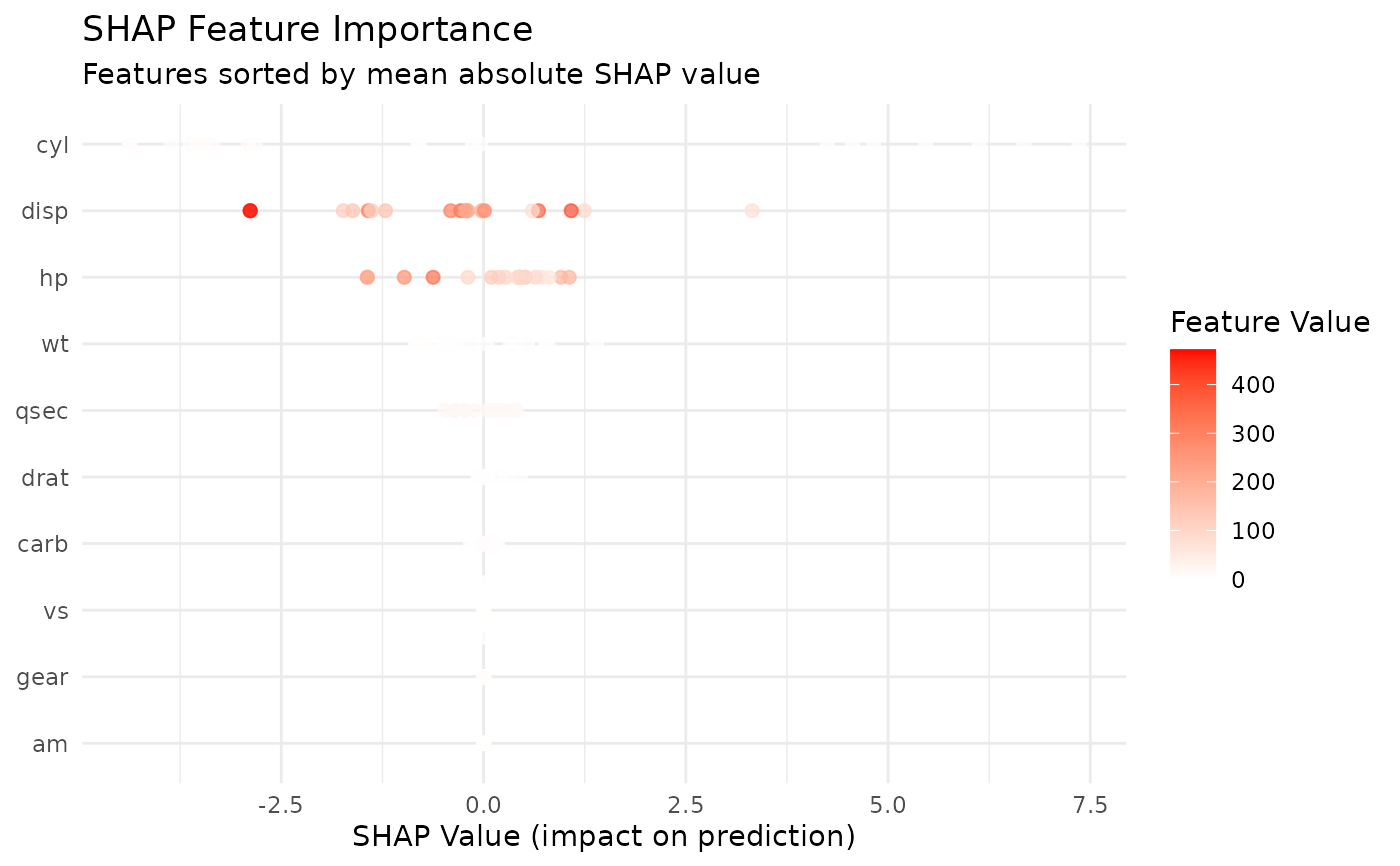
Plot SHAP summary for XGBoost model
Value
A ggplot object. Features are ranked by
mean absolute SHAP value; a multiclass model is drawn one panel per
class.
Examples
# \donttest{
if (requireNamespace("xgboost", quietly = TRUE)) {
model <- tl_model(mtcars, mpg ~ ., method = "xgboost", nthread = 2)
tl_plot_xgboost_shap_summary(model, n_samples = 20)
}
 # }