
Create visualizations of association rules
Value
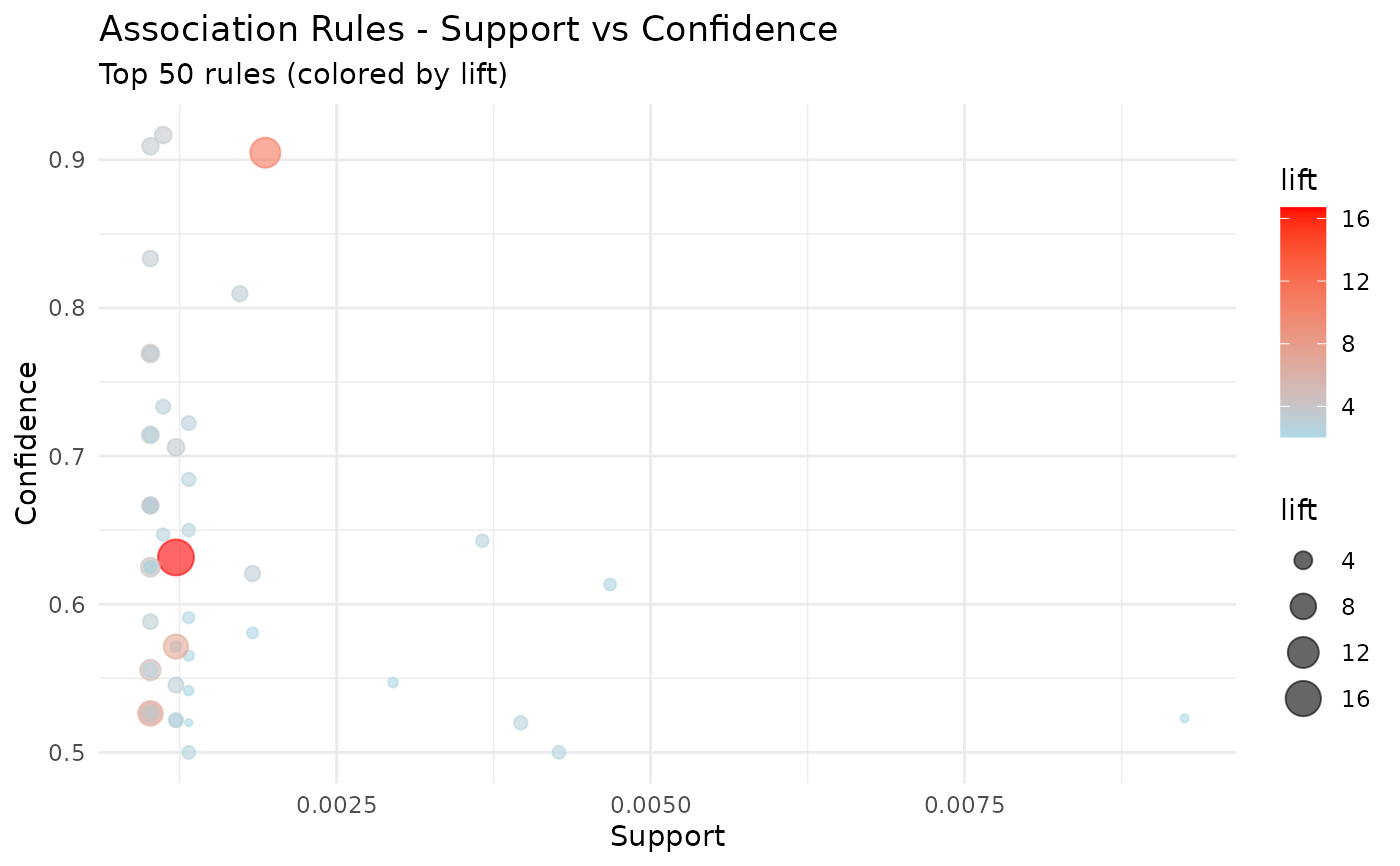
A ggplot object when
method = "scatter".
For other methods, the plot is produced as a side effect via
arulesViz.
Examples
# \donttest{
if (requireNamespace("arules", quietly = TRUE)) {
data("Groceries", package = "arules")
res <- tidy_apriori(Groceries, support = 0.001, confidence = 0.5)
visualize_rules(res, method = "scatter")
}
#> Apriori
#>
#> Parameter specification:
#> confidence minval smax arem aval originalSupport maxtime support minlen
#> 0.5 0.1 1 none FALSE TRUE 5 0.001 2
#> maxlen target ext
#> 10 rules TRUE
#>
#> Algorithmic control:
#> filter tree heap memopt load sort verbose
#> 0.1 TRUE TRUE FALSE TRUE 2 TRUE
#>
#> Absolute minimum support count: 9
#>
#> set item appearances ...[0 item(s)] done [0.00s].
#> set transactions ...[169 item(s), 9835 transaction(s)] done [0.00s].
#> sorting and recoding items ... [157 item(s)] done [0.00s].
#> creating transaction tree ... done [0.00s].
#> checking subsets of size 1 2 3 4 5 6 done [0.01s].
#> writing ... [5668 rule(s)] done [0.00s].
#> creating S4 object ... done [0.00s].
 # }
# }